
ECON 121 Discussion: Week 4
Slides available here:
All discussion slides here:

“First, A Word From Our Sponsors”
Economics Department Mentorship Program
The Economics Department is starting a student mentorship program!
If you’re interested in economics and would like to be matched up with an upper-level undergraduate student for economics help and advice fill out this survey:

Today’s Plan
- A short deep-dive into how CPI is actually calculated + formula review
- More practice with market basket costs and price indices
More Price Index Practice
Chapter 7
What Goes Into the Consumer Price Index?
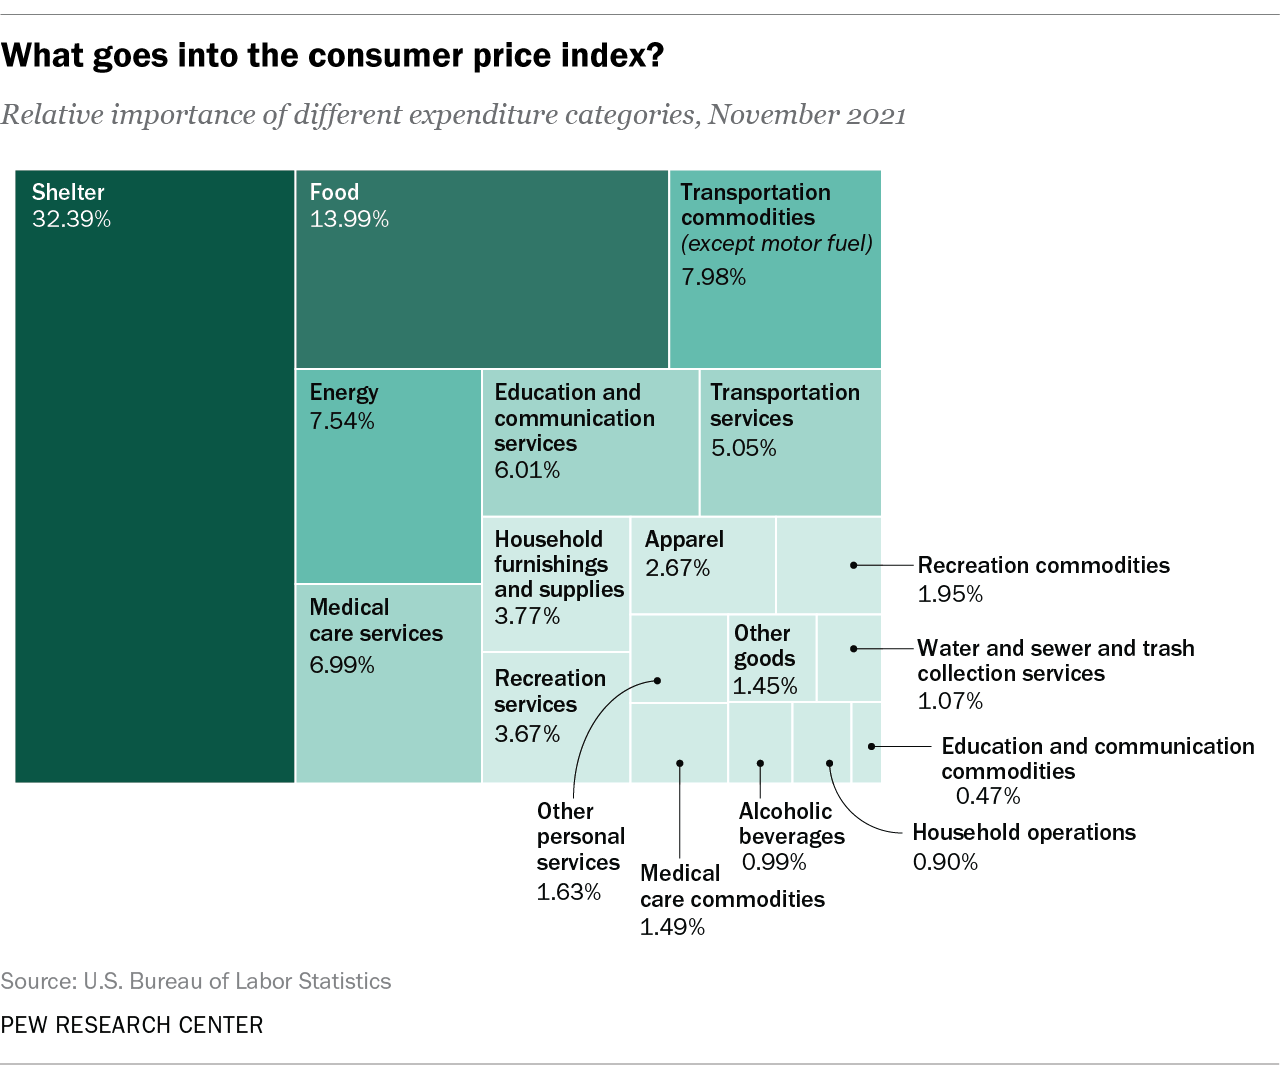
Source: Pew Research Center using BLS data (2022)
Where Do CPI Data Come From?

The Bureau of Labor Statistics collects price data from a sample of cities across the U.S.
BLS data collectors visit or call stores and check store websites to collect ~100,000 prices of goods in the CPI market basket per month
- Around 2/3rds of these prices come from data collectors physically visiting stores!
Check out BLS’s FAQ about CPI for more details
Remember…
To calculate a price index we need to
calculate the cost of a market basket that’s common between two years
pick a base year and then calculate the price index for our years of interest using the formula below
\[ \text{Price index} = \frac{\text{Current year basket cost}}{\text{Base year basket cost}} \times 100 \]
To calculate the GDP deflator we need to
calculate the nominal GDP in two years (quantity of each good in each year \(\times\) price of each good in each year)
pick a base year, then calculate the non-base year’s real GDP (what the nominal GDP of the non-base year would have been with the base year’s prices)
then the GDP deflator for the non-base year is
\[ \text{GDP Deflator} = \frac{\text{Nominal GDP}}{\text{Real GDP}} \times 100 \]
Why Have Multiple Ways To Deflate GDP?
The main difference between the GDP deflator method and the price index method is…
price indices like CPI use a fixed basket of goods that’s only updated periodically
the GDP deflator doesn’t use a fixed basket of goods: the GDP deflator considers “all” goods and services and so includes more than just what consumers buy and the basket’s composition includes what people + businesses actually consumed in the amounts they actually consumed it
Why not always use the GDP deflator if it includes “all” goods and services? It depends what goods and services we care about.
I usually see people using CPI to deflate nominal values. In the real world, the two tend to give similar results.
From Last Week: Practice Problem #3
Use the information in the table to calculate a consumer price index (CPI) and the inflation rate. The base year is 2020.
What’s the CPI for 2020? 2021? The inflation rate between the two years?
| Item | Qty. | 2020 Price | 2021 Price |
|---|---|---|---|
| Bread | 3 | $2 | $3 |
| Gas | 20 | $3 | $4 |
| Shoes | 1 | $90 | $80 |
Answer
First calculate the costs of the market baskets:
\[ \begin{align*} \text{2020 Cost} &= (\text{Qty Bread } \times \text{ '20 Price}) + (\text{Qty Gas } \times \text{ '20 Price}) + (\text{Qty Shoes } \times \text{ '20 Price}) \\ &= (3 \times 2) + (20 \times 3) + (1 \times 90) \\ &= 156 \end{align*} \]
2021 basket cost (same formula with 2021 prices): \(169\)
From Last Week: Practice Problem #3
Use the information in the table to calculate a consumer price index (CPI) and the inflation rate. The base year is 2020.
What’s the CPI for 2020? 2021? The inflation rate between the two years?
| Item | Qty. | 2020 Price | 2021 Price |
|---|---|---|---|
| Bread | 3 | $2 | $3 |
| Gas | 20 | $3 | $4 |
| Shoes | 1 | $90 | $80 |
Answer
Then calculate the price indices (let’s start with 2021, using 2020 as the base year):
\[ \begin{align*} \text{2021 CPI} &= \frac{\text{2021 Basket Cost}}{\text{2020 Basket Cost}} \times 100 &= \frac{169}{156} \times 100 = 108.\bar{3} \end{align*} \]
Notice when you calculate 2020 CPI it’s \(100\) since it’s the base year!
From Last Week: Practice Problem #3
Use the information in the table to calculate a consumer price index (CPI) and the inflation rate. The base year is 2020.
What’s the CPI for 2020? 2021? The inflation rate between the two years?
| Item | Qty. | 2020 Price | 2021 Price |
|---|---|---|---|
| Bread | 3 | $2 | $3 |
| Gas | 20 | $3 | $4 |
| Shoes | 1 | $90 | $80 |
Answer
Inflation is the percentage change between the two price index values:
\[ \begin{align*} \text{Inflation Rate} &= \frac{\text{New CPI } - \text{Old CPI}}{\text{Old CPI}} \times 100 \\ &= \frac{108.\bar{3} - 100}{100} \times 100 = 8.\bar{3} \% \end{align*} \]
::::
Practice Problem #1: Using The GDP Deflator
There’s an economy that consists only of the consumption of two goods: boots 👢 and purses 👜. The quantities of boots and purses and their prices are listed below for 2023 and 2024. What was the nominal GDP in each year?
| Item | 2023 Qty. | 2023 Price | 2024 Qty. | 2024 Price |
|---|---|---|---|---|
| 👢 | 3 | $100 | 2 | $120 |
| 👜 | 5 | $200 | 7 | $150 |
Answer
Multiply the quantities and costs of the goods in the market basket to calculate the nominal GDP per capita each year:
\(\text{Nominal GDP}_{2023} = 3 \times 100 + 5 \times 200 = 1300\)
\(\text{Nominal GDP}_{2024} = 2 \times 120 + 7 \times 150 = 1290\)
Practice Problem #1: Using The GDP Deflator
There’s an economy that consists only of the consumption of two goods: boots 👢 and purses 👜. The quantities of boots and purses and their prices are listed below for 2023 and 2024. Use 2023 as the base year. What was the real GDP in 2024? Hint: we pretend one year had another year’s prices when deflating GDP.
| Item | 2023 Qty. | 2023 Price | 2024 Qty. | 2024 Price |
|---|---|---|---|---|
| 👢 | 3 | $100 | 2 | $120 |
| 👜 | 5 | $200 | 7 | $150 |
Practice Problem #1: Using The GDP Deflator
There’s an economy that consists only of the consumption of two goods: boots 👢 and purses 👜. The quantities of boots and purses and their prices are listed below for 2023 and 2024. Use 2023 as the base year. What was the real GDP in 2024?
| Item | 2023 Qty. | 2023 Price | 2024 Qty. | 2024 Price |
|---|---|---|---|---|
| 👢 | 3 | $100 | 2 | $120 |
| 👜 | 5 | $200 | 7 | $150 |
Answer
Multiply 2024’s quantities by 2023’s prices:
\(\text{Real GDP}_{2024} = 2 \times 100 + 7 \times 200 = 1600\)
This means 2024’s GDP was worth $1600 in 2023 prices (when GDP was $1300).
Does this mean the economy got bigger/richer?
Practice Problem #2: Price Index Adjustment of GDP
Now say the economy has lots of goods but the market basket only consists of two goods: coats 🧥 and guitars 🎸. Nominal GDP per capita in 2023 was $60,000 and $80,000 in 2024. What was the cost of the market baskets in each year?
| Item | Qty. | 2023 Price | 2024 Price |
|---|---|---|---|
| 🧥 | 5 | $120 | $110 |
| 🎸 | 7 | $150 | $220 |
Answer
Multiply the quantities and costs of the goods in the market basket to calculate the costs of the market baskets each year:
\(\text{Cost}_{2023} = 5 \times 120 + 7 \times 150 = 1650\)
\(\text{Cost}_{2024} = 5 \times 110 + 7 \times 220 = 2090\)
Practice Problem #2: Price Index Adjustment of GDP
Now say the economy has lots of goods but the market basket only consists of two goods: coats 🧥 and guitars 🎸. Nominal GDP per capita in 2023 was $60,000 and $80,000 in 2024. Use 2023 at the base year. What was the real GDP per capita in each year (in 2023 dollars)?
| Item | Qty. | 2023 Price | 2024 Price |
|---|---|---|---|
| 🧥 | 5 | $120 | $110 |
| 🎸 | 7 | $150 | $220 |
| Basket cost: | $1650 | $2090 |
Answer
Use the price index formula
\(\text{PI} = \frac{\text{New Year Basket Cost}}{\text{Base Year Basket Cost}} \times 100\)
to calculate the price indices for each year:
\(\text{PI}_{2023} = \frac{1650}{1650} \times 100 = 100\)
\(\text{PI}_{2024} = \frac{2090}{1650} \times 100 \approx 126.7\)
Multiply each year’s nominal GDP per capita by the ratio of base and current year CPIs to get the real amounts in 2023 dollars:
\(\text{Real}_{2023} = 60000 \times \frac{100}{100} = 60000\)
\(\text{Real}_{2024} = 80000 \times \frac{100}{126.7} \approx 63141.28\)
Practice Problem #2: Price Index Adjustment of GDP
Now say the economy has lots of goods but the market basket only consists of two goods: coats 🧥 and guitars 🎸. Nominal GDP per capita in 2023 was $60,000 and $80,000 in 2024. Did people’s purchasing power increase or decrease between 2023 and 2024? Why?
| Item | Qty. | 2023 Price | 2024 Price |
|---|---|---|---|
| 🧥 | 5 | $120 | $110 |
| 🎸 | 7 | $150 | $220 |
| Basket cost: | $1650 | $2090 |
Answer
Purchasing power increased but not as much as the increase in nominal GPD per capita might suggest! The rise in the market basket cost (driven by rising guitar prices) means that real GDP per capita in 2023 dollars only increased by ~$3000 even though nominal GDP per capita increased by $20000!
Another way to think of this: nominal GDP per capita increased by \(\frac{80000}{60000} = 1.\bar{3}\) but the price of the market basket increased almost just as much, \(\frac{2090}{1650} = 1.2\bar{6}\).