Supply and Demand Review
Chapter 3
Demand and Shifts In Demand
“Demand” refers to the entire market demand for a good, represented by the demand curve; “quantity demanded” refers to a quantity point on the demand curve. These are not the same!
Several things can increase/decrease the demand for a good:
- Changes in the prices of related goods
- Complements are goods that are bought together
- Substitutes are goods that buyers will choose one or the other of
- Changes in buyers’ income
- Normal goods: goods people buy more of if income \(\uparrow\)
- Inferior goods: goods people buy less of if income \(\downarrow\)
- Changes in tastes or preferences
- Changes in expectations about the future
- Changes in how many buyers there are
Supply and Shifts In Supply
“Supply” refers to the entire market supply for a good, represented by the supply curve; “quantity supplied” refers to a quantity point on the supply curve. These are also not the same!
Several things can increase/decrease the supply of a good:
- Changes in input prices
- “Inputs” = “ingredients” to make a good: if rice prices rise, Chipotle will raise prices
- Changes in prices of related goods
- Changes in technology
- Advances in production technology can make it cheaper to produce a good
- Changes in expectations about the future
- Changes in how many sellers/producers there are
Side Note… What’s Up With Egg Prices?
![]()
Paul Newman getting ready to eat 50 eggs in Cool Hand Luke
Practice Question #1
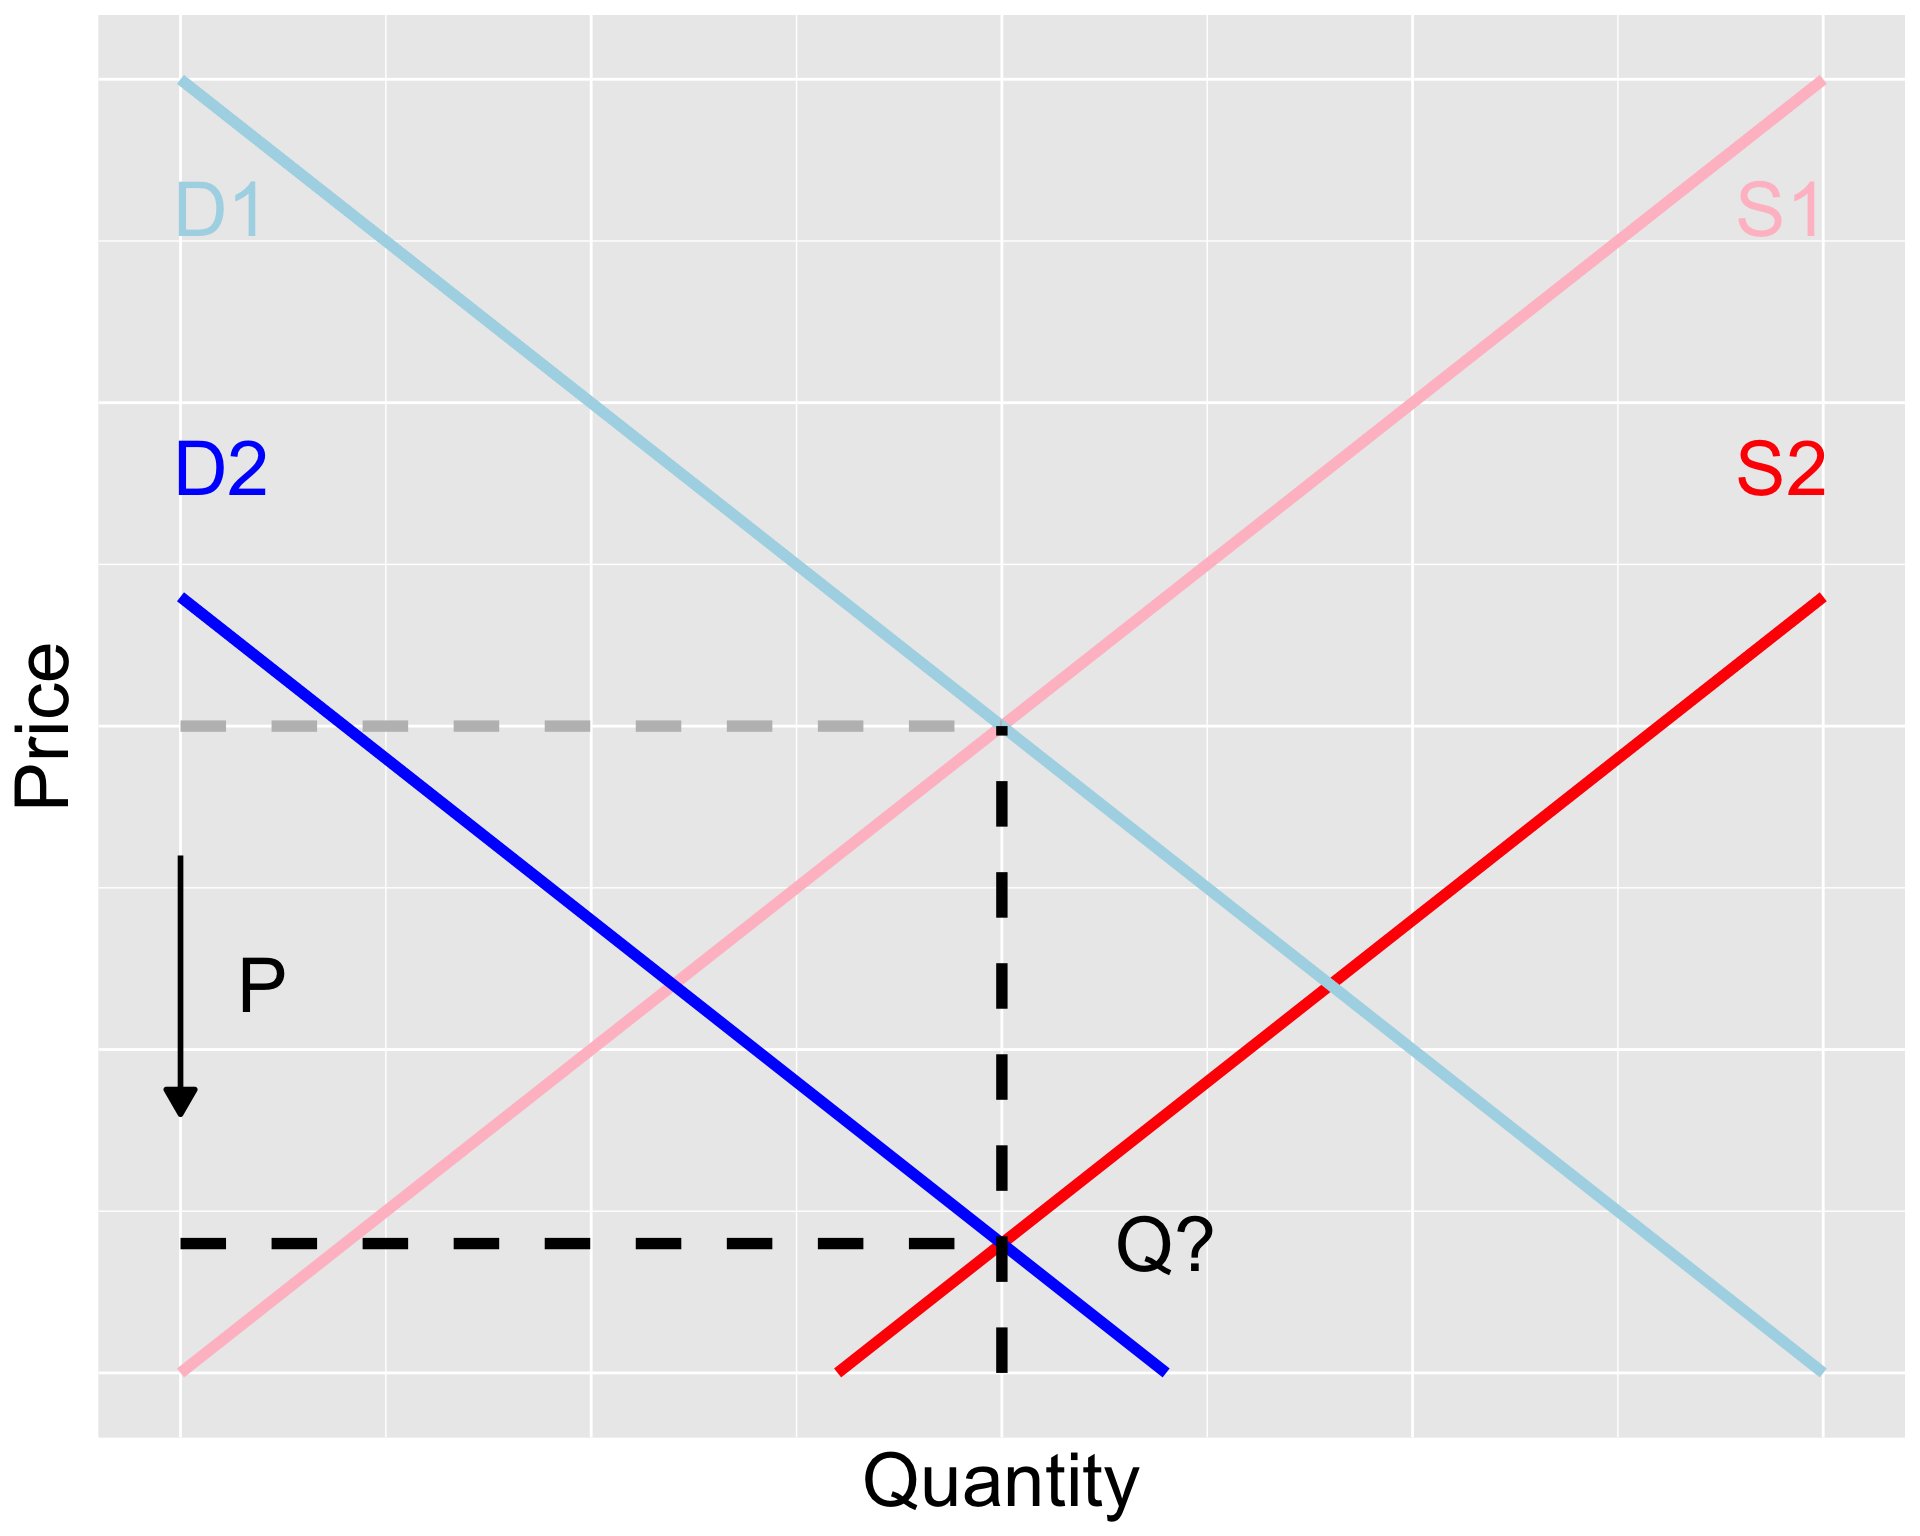
A state initiative to increase heating efficiency via heat pumps and retrofitting has reduced the need for natural gas in Illinois. Additionally, a new geologic formation was found that contains natural gas. As it stands, the relative magnitude of these events is uncertain.
Determine what happens to equilibrium price and quantity in the market for natural gas.
Practice Question #1
A state initiative to increase heating efficiency via heat pumps and retrofitting has reduced the need for natural gas in Illinois. Additionally, a new geologic formation was found that contains natural gas. As it stands, the relative magnitude of these events is uncertain.
Determine what happens to equilibrium price and quantity in the market for natural gas.
Both the demand and supply for natural gas are shifting. Demand decreases because of the state heating initiative. Supply increases because of the discovery of the new formation.
The equilibrium price of natural gas will decrease but the change in equilibrium quantity is ambiguous.
Practice Problem #2
The accompanying table provides the annual U.S. demand and supply schedules for pickup trucks (in millions of trucks). Using the data in the table, identify the equilibrium price and quantity.
| $20,000 |
20 |
14 |
| $25,000 |
18 |
15 |
| $30,000 |
16 |
16 |
| $35,000 |
14 |
17 |
| $40,000 |
12 |
18 |
Demand and supply schedules give us the same information as a supply & demand chart, just in table form.
Quantity demanded and supplied are equal at 16, so this is where the equilibrium quantity is. The corresponding equilibrium price is $30,000
Gross Domestic Product
Chapter 7
Gross Domestic Product
GDP counts the value of all final goods and services sold in an economy. It’s a measure of how “big” an economy is.
Goods can be both final and intermediate goods but we only include final goods in GDP
Flour is a final good if you buy it at Mariano’s but it’s an intermediate good if sold to a baker who makes bread with it
Calculating Gross Domestic Product
\[
GDP = C + I + G + X - IM
\]
C = consumer spending
I = investment
G = government purchases
X = exports
IM = imports
As you study macro further a few more letters will get added to this equation
- Some textbooks call X - IM “net exports” and lump this into one variable NX
It’s worth looking at each of these individually…
Consumer Spending
C: how much consumers in an economy spend on final goods and services
Examples:
- Buying your weekly groceries
- Purchasing a new refrigerator for your home
Consumer expenditures in the U.S.:
Investment
I: physical capital purchases, R&D expenditures, changes in business inventories, and construction (NOT “stocks and bonds” investment)
Examples:
- A car factory buys a new metal-stamping machine
- A real estate developers builds new homes
Investment in the U.S.:
Government Purchases
G: government purchases of goods and services (does NOT include social security and welfare transfers)
Examples:
- the U.S. Navy commissions a new submarine
- the Dept. of Transportation buys a new data storage system
Government purchases in the U.S.:
Exports
X: goods and services one country sells to another
Examples:
- U.S. oil companies sell petroleum to Canada (oil has been the top U.S. export good since 2008!)
- Microsoft sells a Windows license to a user in South Africa
U.S. total exports value:
Imports
IM: goods and services one country buys from another
Examples:
- You purchase a new phone from Samsung, a South Korean company
- You buy coffee beans grown in Colombia
U.S. total imports value:
Adjusting For Price Changes
Prices of goods and services change over time: we need to adjust for this in order to compare GDP (and other macroeconomic values) fairly across time.
We can “deflate” GDP and compare “real GDP” across time periods:
- Nominal GDP: GDP in one year using that year’s prices
- Real GDP: GDP in one year using another year’s prices
We can also calculate a price index like the Consumer Price Index (CPI): take a group of goods (“market basket”) and calculate the ratio of the groups’ weighted average prices between two points in time
\[
\text{Price index} = \frac{\text{Current year basket cost}}{\text{Base year basket cost}} \times 100
\]
Then we calculate inflation as the percentage change in the price index
\[
\text{Inflation} = \frac{\text{New price index } - \text{ Old price index}}{\text{Old price index}} \times 100
\]
Practice Problem #1
Each of the below belongs to which part (consumption, investment, government purchases, exports, imports) of GDP?
UIC builds a new lecture hall on campus
You buy a ticket to a Cubs game
United Airlines buys new plane maintenance equipment, made in the U.S., to use at O’Hare
AbbVie, a pharmaceutical company based in North Chicago, sells an arthritis drug to hospitals in China
Chrysler’s plant in Belvedere buys steel made in Indiana to make cars
Government purchases
Consumption
Investment
Exports
None! This steel is an intermediate good and isn’t counted in GDP
Practice Problem #2
Given information about the economy of Pakistan, calculate Pakistan’s GDP. Note that the currency of Pakistan is the rupee. Assume that the values are all current and no conversions need to be made.
- The government spends 2.70 trillion rupees.
- Individuals consume 10.00 trillion rupees.
- Individuals save 5.50 trillion rupees.
- Businesses invest 1.75 trillion rupees.
- Foreigners invest 0.57 trillion rupees.
- Pakistan imports 2.50 trillion rupees.
- Pakistan exports 1.35 trillion rupees.
Savings and foreign investment don’t go into GDP. Then use the GDP equation:
\[
\begin{align*}
GDP &= C + I + G + X - IM \\
&= 10 + 1.75 + 2.7 + 1.35 - 2.5 \\
&= 13.3 \text{ trillion rupees}
\end{align*}
\]
Practice Problem #3
Use the information in the table to calculate a consumer price index (CPI) and the inflation rate. The base year is 2020.
What’s the CPI for 2020? 2021? The inflation rate between the two years?
| Bread |
3 |
$2 |
$3 |
| Gas |
20 |
$3 |
$4 |
| Shoes |
1 |
$90 |
$80 |
Practice Problem #3
Use the information in the table to calculate a consumer price index (CPI) and the inflation rate. The base year is 2020.
What’s the CPI for 2020? 2021? The inflation rate between the two years?
| Bread |
3 |
$2 |
$3 |
| Gas |
20 |
$3 |
$4 |
| Shoes |
1 |
$90 |
$80 |
First calculate the costs of the market baskets:
\[
\begin{align*}
\text{2020 Cost} &= (\text{Qty Bread } \times \text{ '20 Price}) + (\text{Qty Gas } \times \text{ '20 Price}) + (\text{Qty Shoes } \times \text{ '20 Price}) \\
&= (3 \times 2) + (20 \times 3) + (1 \times 90) \\
&= 156
\end{align*}
\]
2021 basket cost (same formula with 2021 prices): \(169\)
Practice Problem #3
Use the information in the table to calculate a consumer price index (CPI) and the inflation rate. The base year is 2020.
What’s the CPI for 2020? 2021? The inflation rate between the two years?
| Bread |
3 |
$2 |
$3 |
| Gas |
20 |
$3 |
$4 |
| Shoes |
1 |
$90 |
$80 |
Then calculate the price indices (let’s start with 2021, using 2020 as the base year):
\[
\begin{align*}
\text{2021 CPI} &= \frac{\text{2021 Basket Cost}}{\text{2020 Basket Cost}} \times 100
&= \frac{169}{156} \times 100 = 108.\bar{3}
\end{align*}
\]
Notice when you calculate 2020 CPI it’s \(100\) since it’s the base year!
Practice Problem #3
Use the information in the table to calculate a consumer price index (CPI) and the inflation rate. The base year is 2020.
What’s the CPI for 2020? 2021? The inflation rate between the two years?
| Bread |
3 |
$2 |
$3 |
| Gas |
20 |
$3 |
$4 |
| Shoes |
1 |
$90 |
$80 |
Inflation is the percentage change between the two price index values:
\[
\begin{align*}
\text{Inflation Rate} &= \frac{\text{New CPI } - \text{Old CPI}}{\text{Old CPI}} \times 100 \\
&= \frac{108.\bar{3} - 100}{100} \times 100 = 8.\bar{3} \%
\end{align*}
\]