
ECON 121 Discussion: Week 2
Slides available here:
All discussion slides here:

About Me

Call me “Isaac”; (he/him)
I’m an econ Ph.D. student
-
🎓 Previously:
- B.S. in Finance, University of Missouri (2015)
- M.A. in Economics, San Diego State University (2021)
👔 Previously: data analyst/scientist positions at CNN, Disney, and the University of Wisconsin-Madison
You can do very cool things with an economics degree! I’m happy to give advice if you’re interested in majoring in econ or might be interested in a graduate degree in econ in the future.
Finding Slopes of Lines
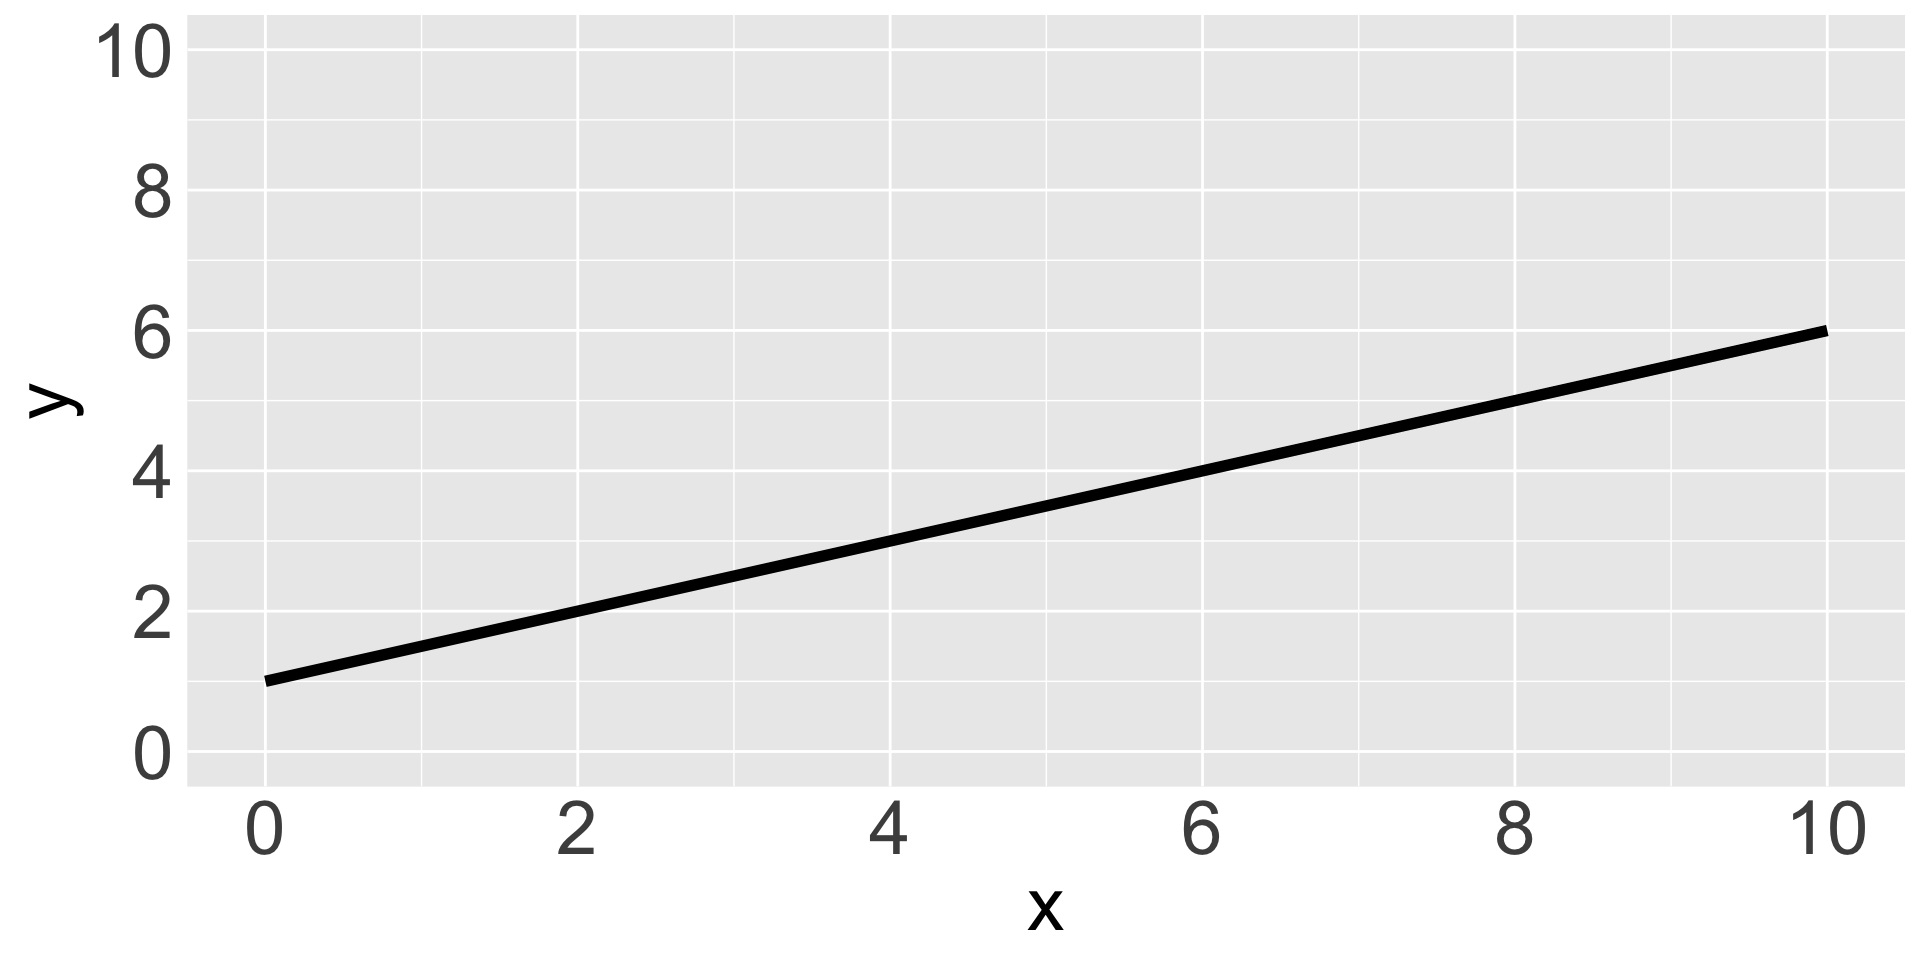
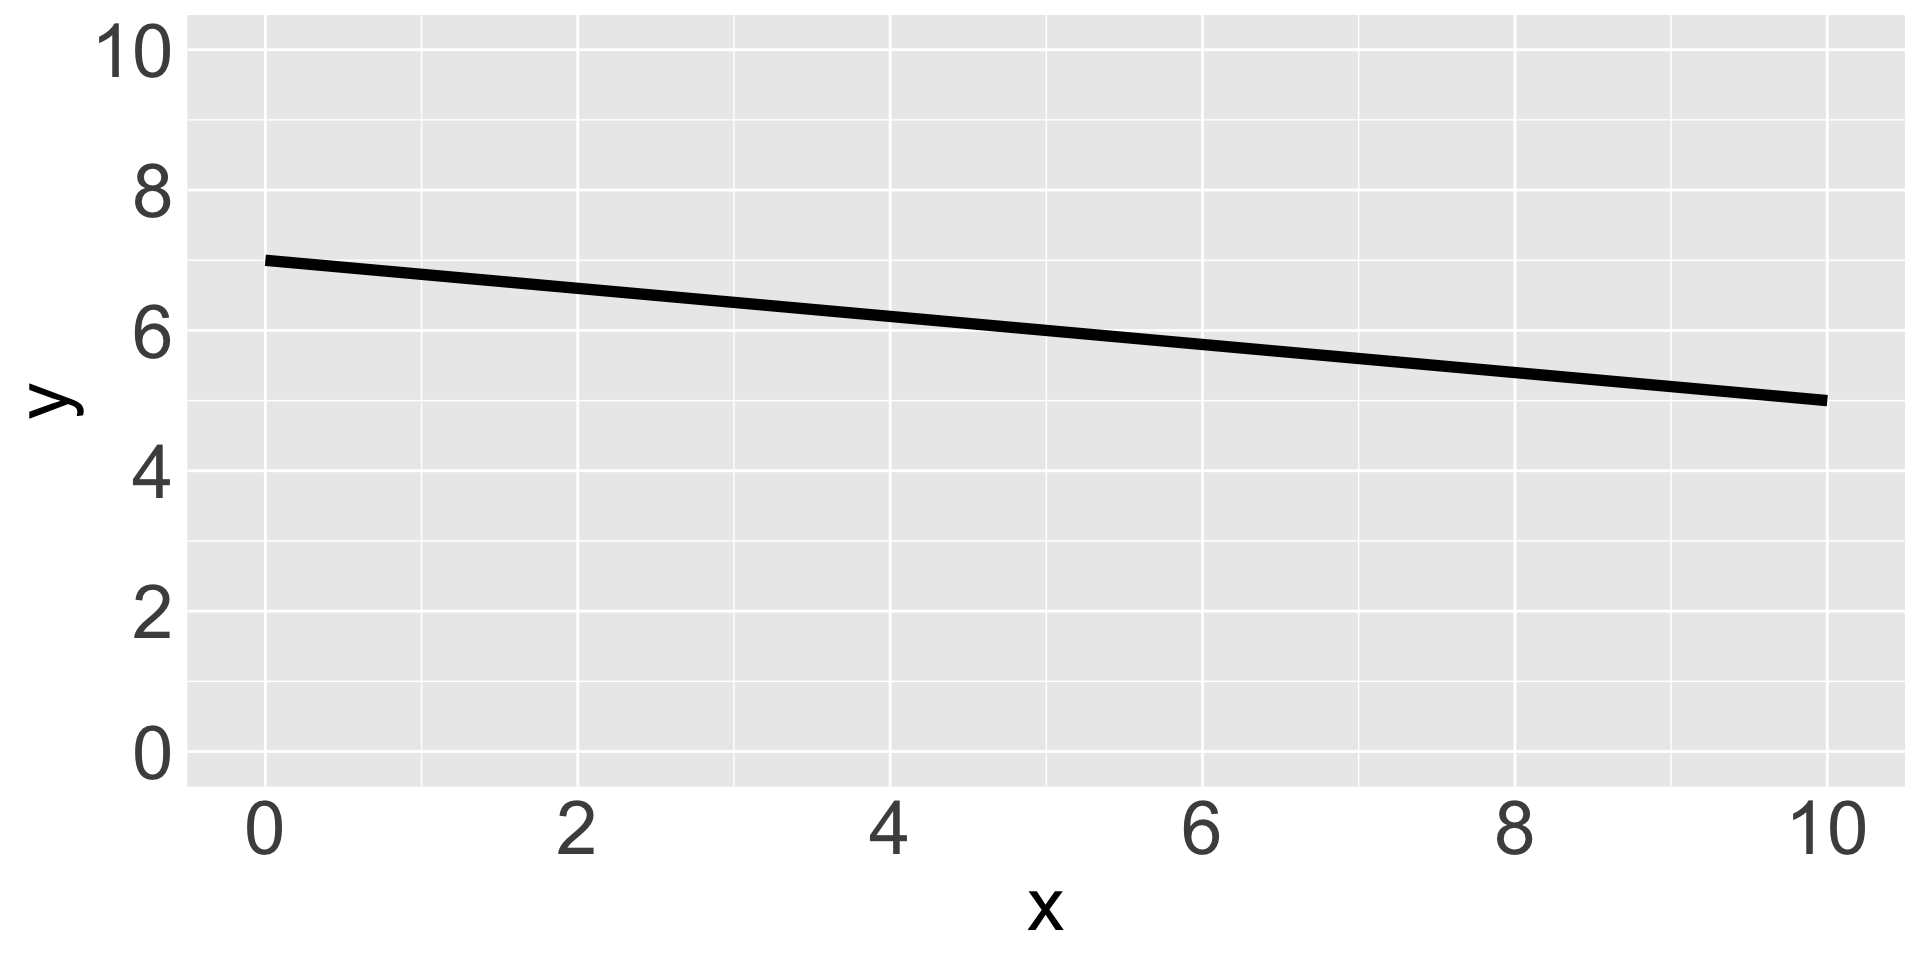
What are the slopes of the lines in the graphs below?
Finding Slopes of Lines
What are the slopes of the lines in the graphs below?
Answer
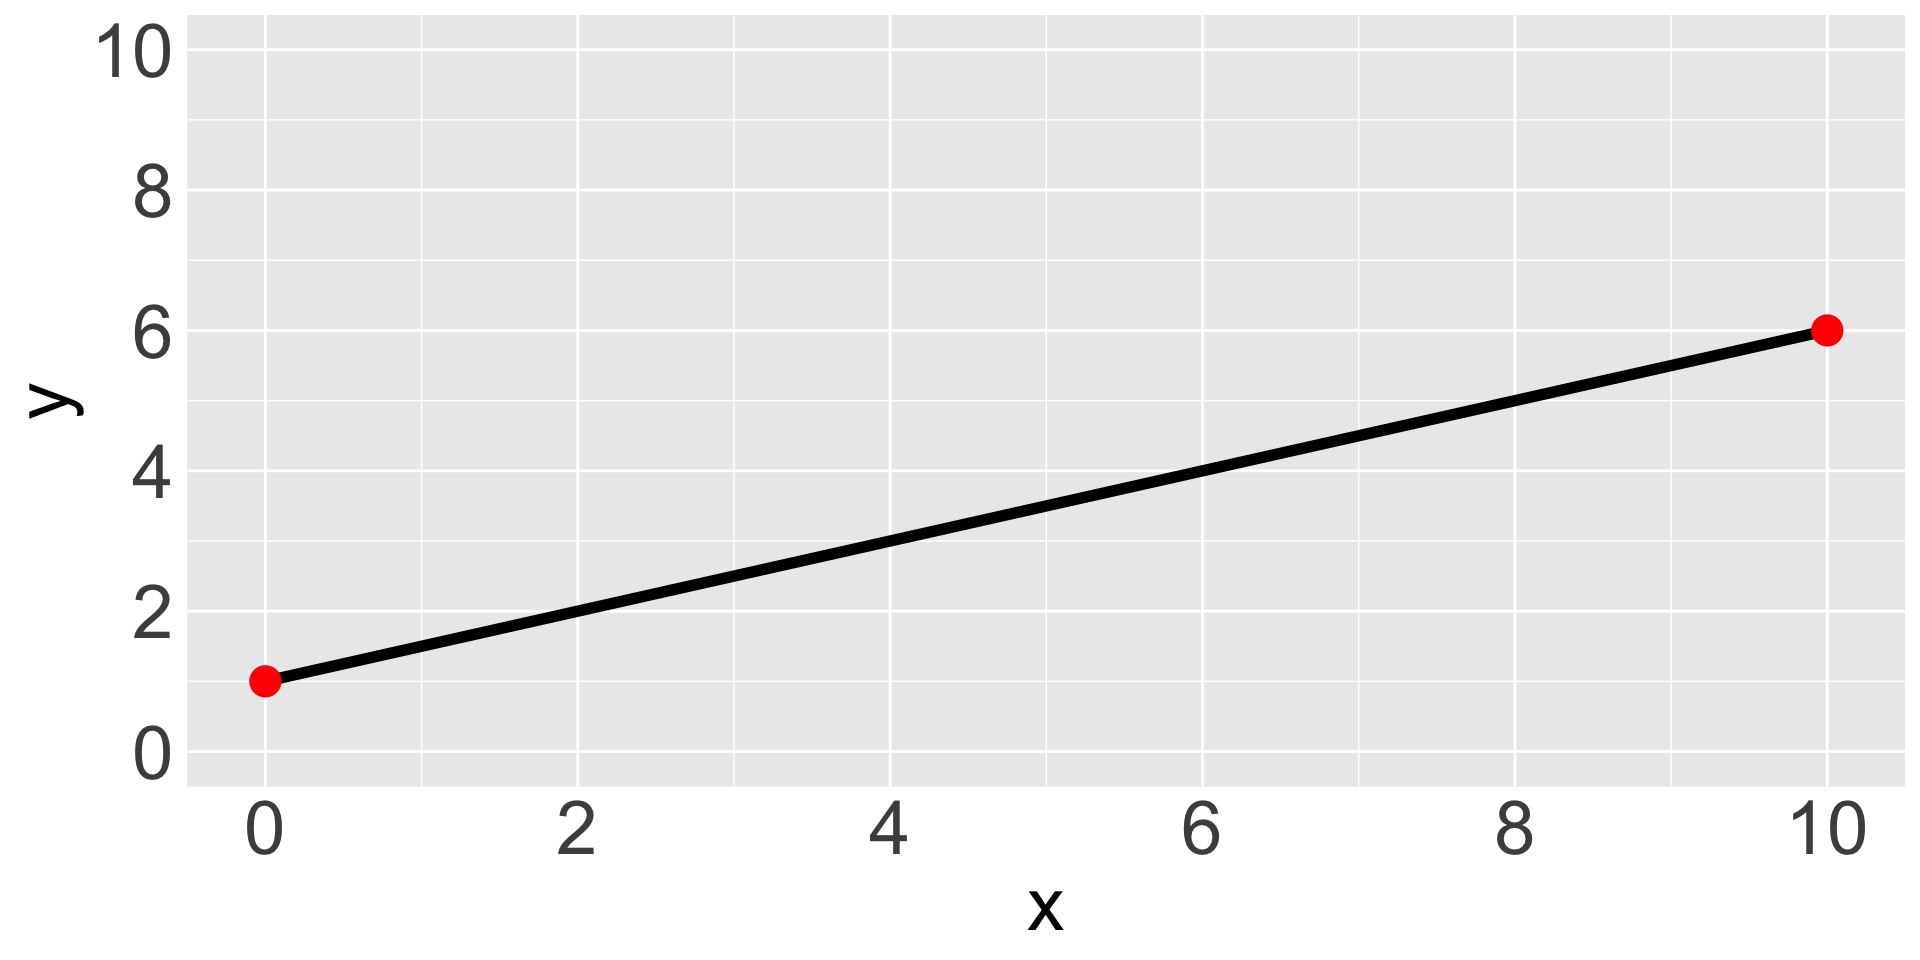
Pick any two points on the line and use the rise-over-run formula. Using the points \((0, 1)\) and \((10, 6)\): \(\frac{6-1}{10-0} = \frac{1}{2}\)
Answer
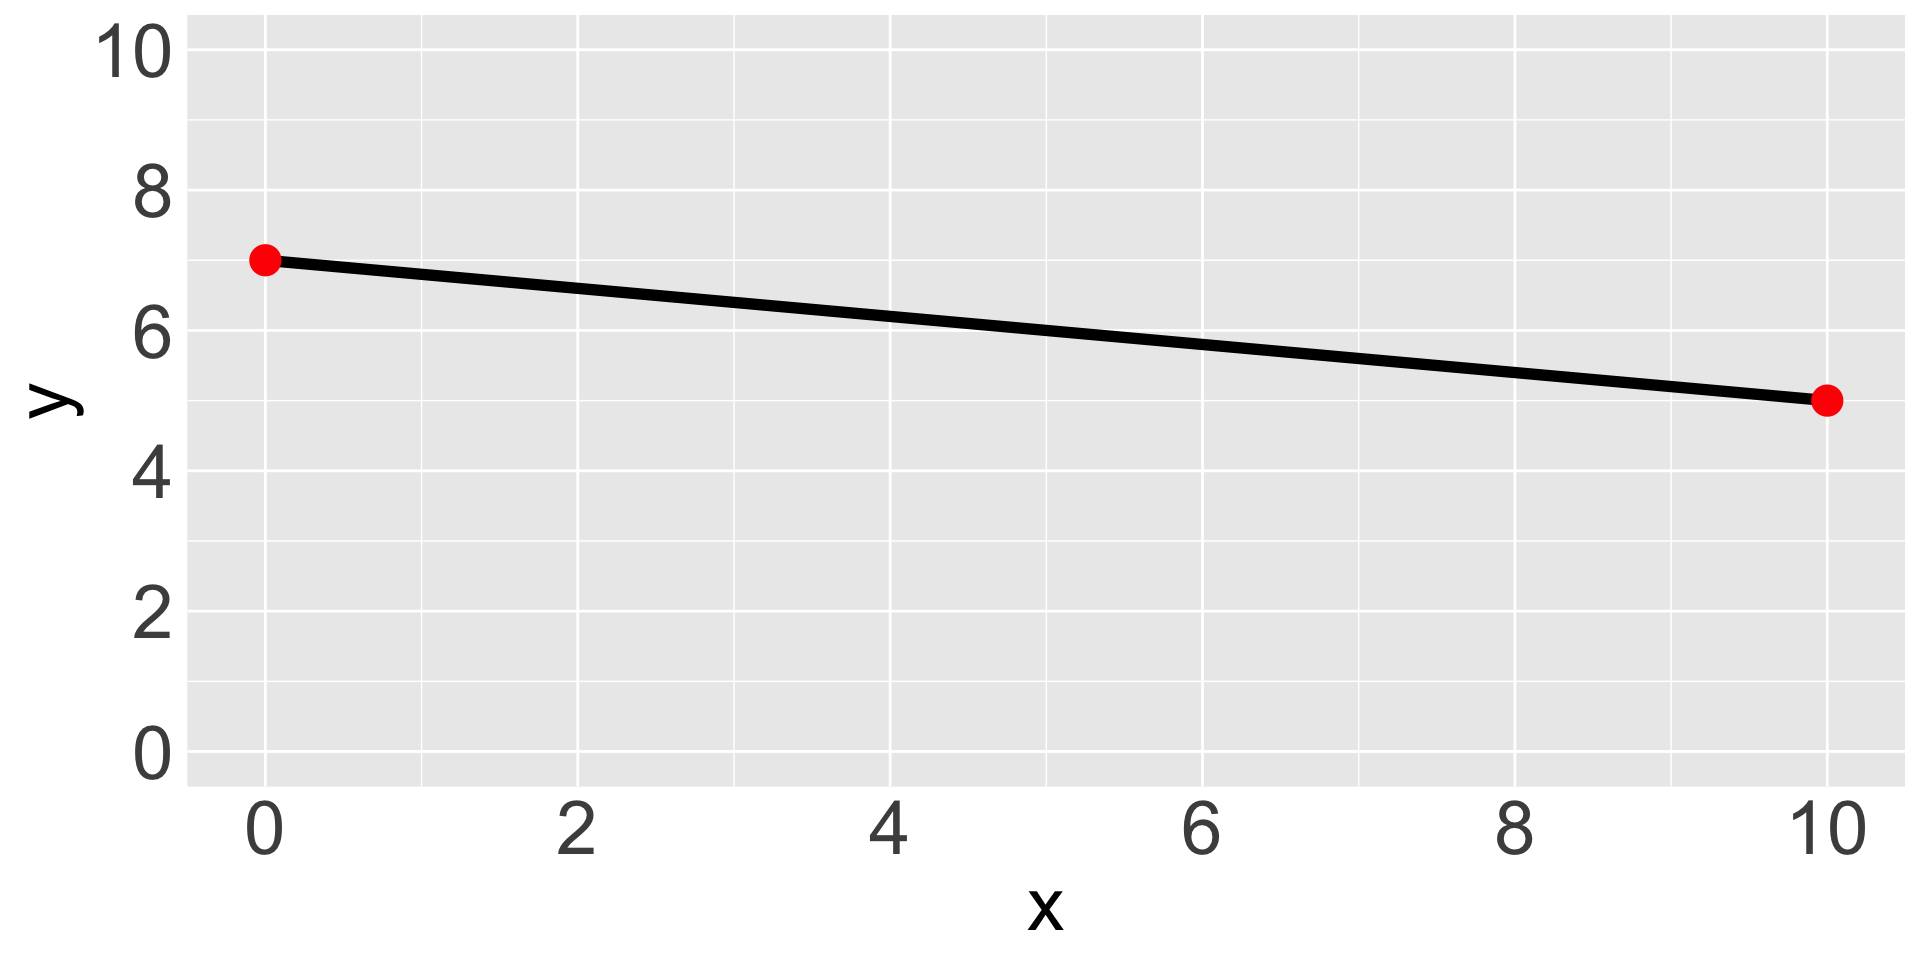
Pick any two points on the line and use the rise-over-run formula. Using the points \((0, 7)\) and \((10, 5)\): \(\frac{5-7}{10-0} = - \frac{1}{5}\)
Finding Slopes of Lines
What are the slopes of the lines in the graphs below?

Finding Slopes of Lines
What are the slopes of the lines in the graphs below?

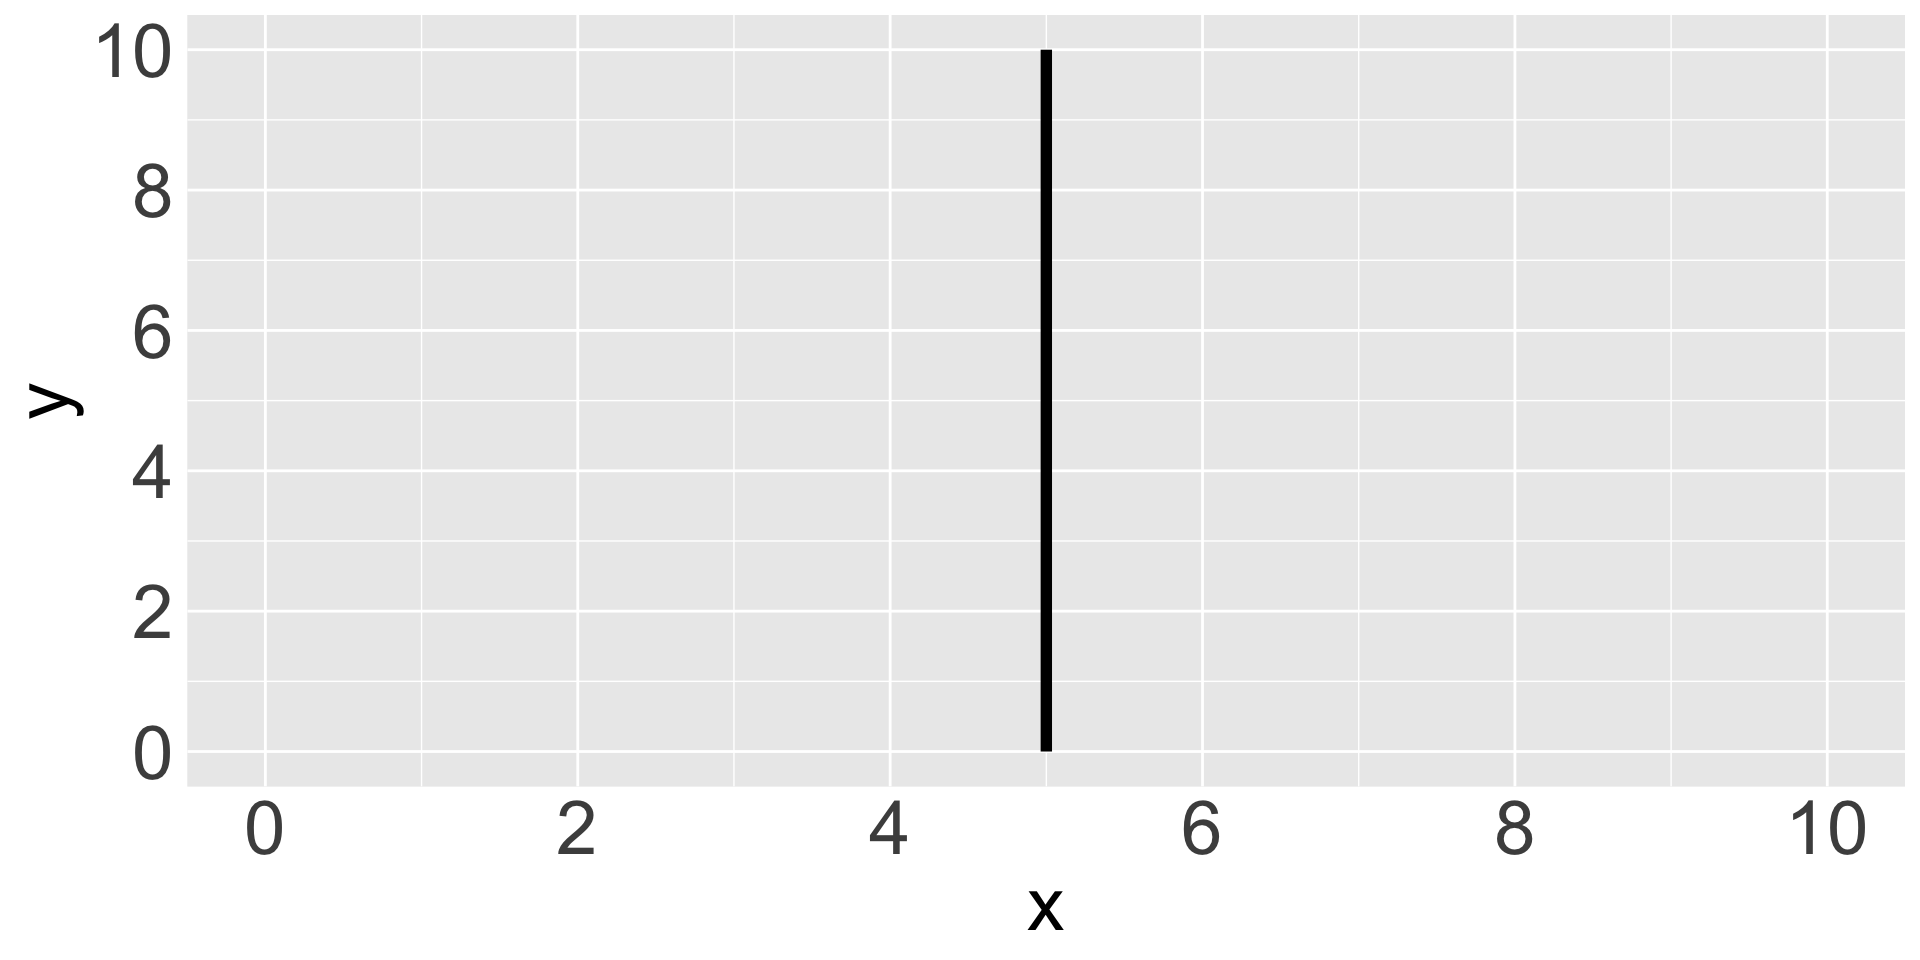
Answer
There’s no “run!” If we use the rise-over-run formula we divide by \(0\), so the slope is undefined.
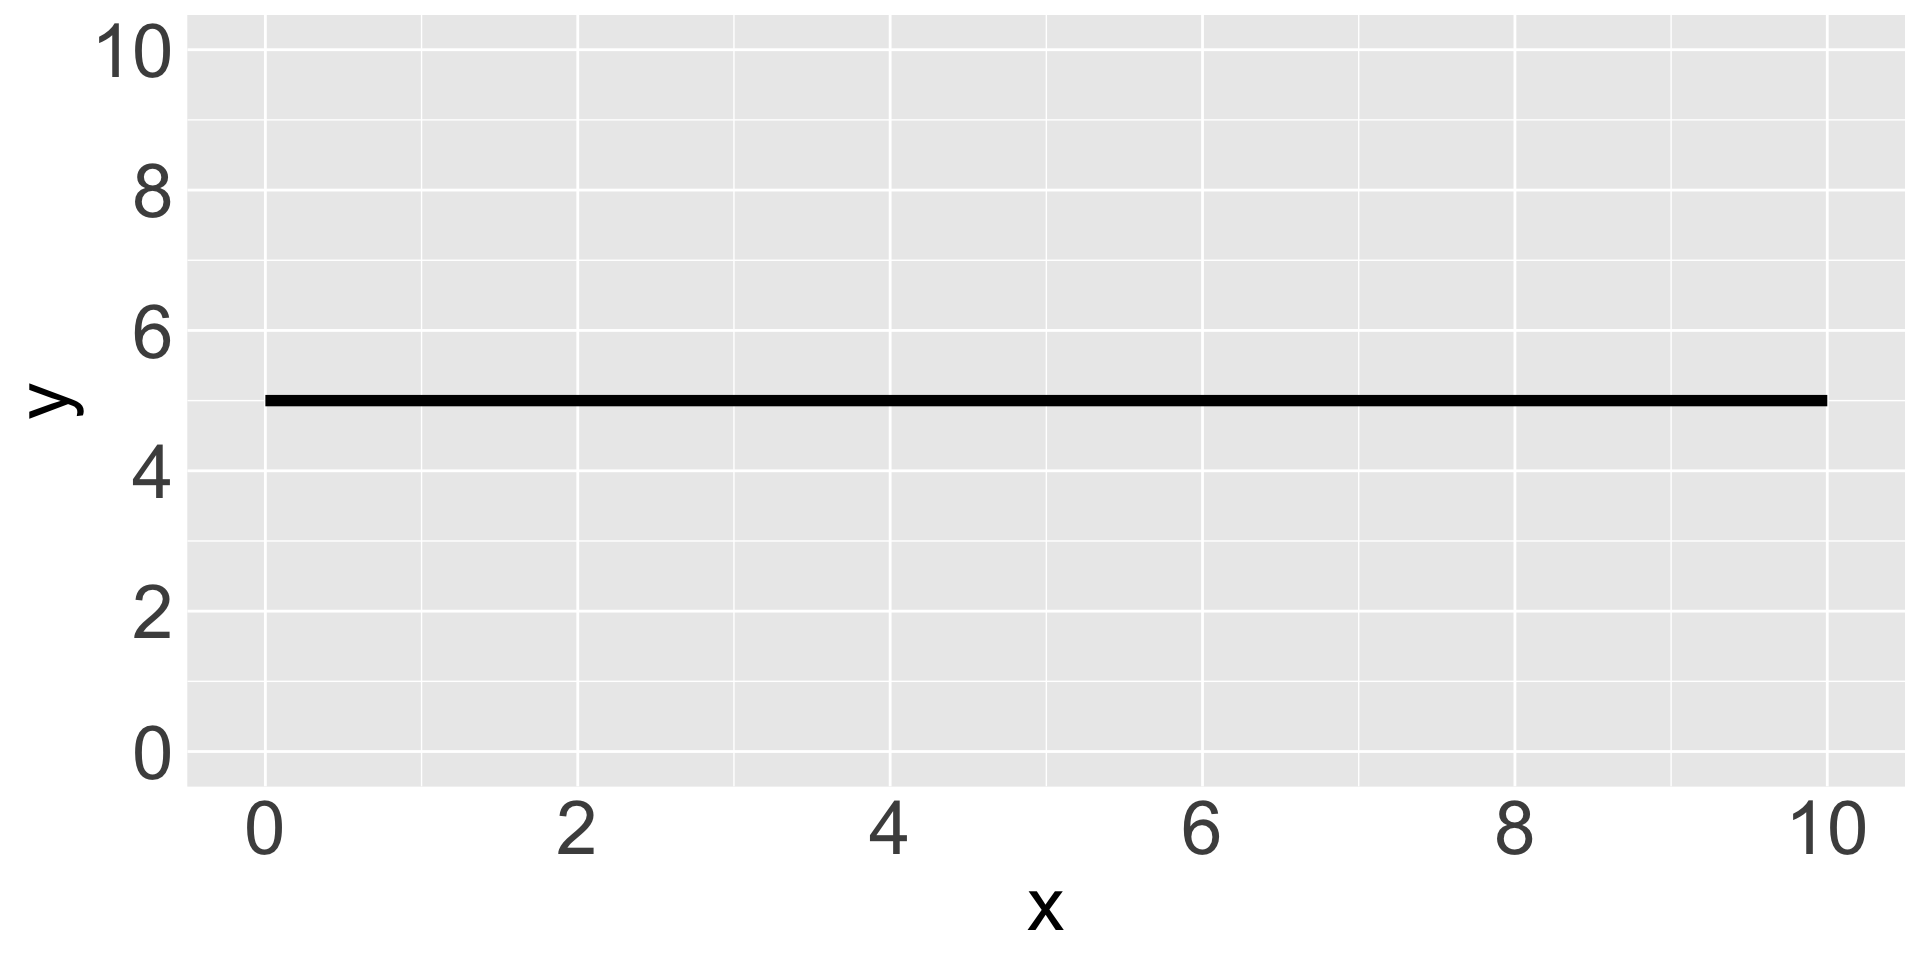
Answer
There’s no “rise!” Using the rise-over-run formula, \(0\) is in the numerator of the fraction. So the slope is \(0\).
Calculating Areas Under and Between Lines
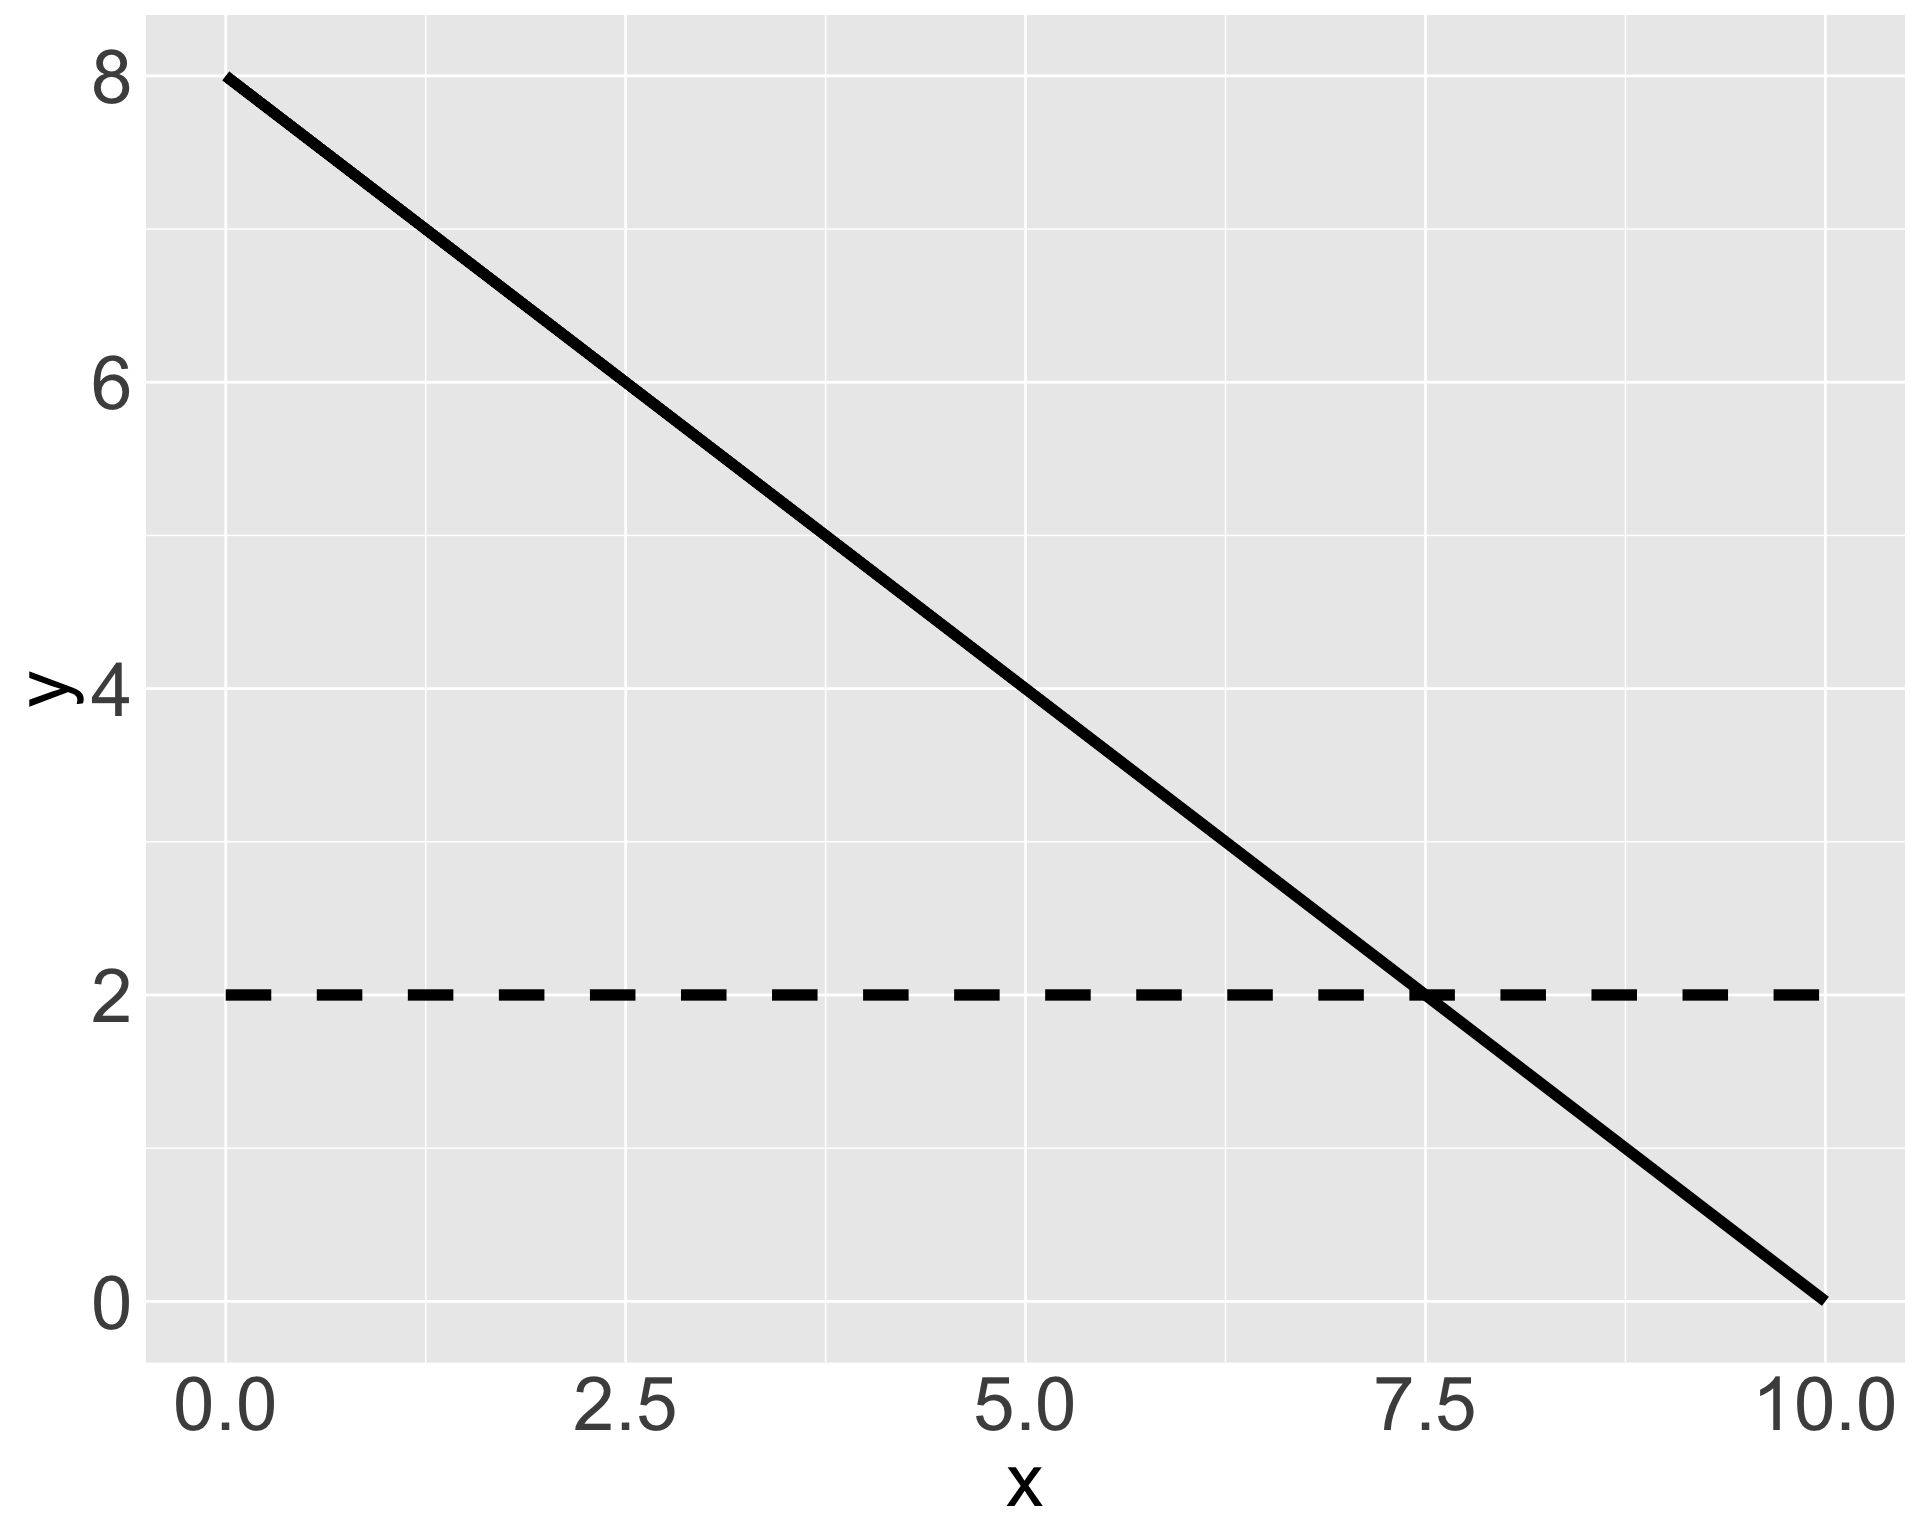
In the graph to the left, what is the area of the space underneath the solid black line but above the dotted black line and to the right of the \(y\) axis?
Calculating Areas Under and Between Lines
In the graph to the left, what is the area of the space underneath the solid black line but above the dotted black line and to the right of the \(y\) axis?
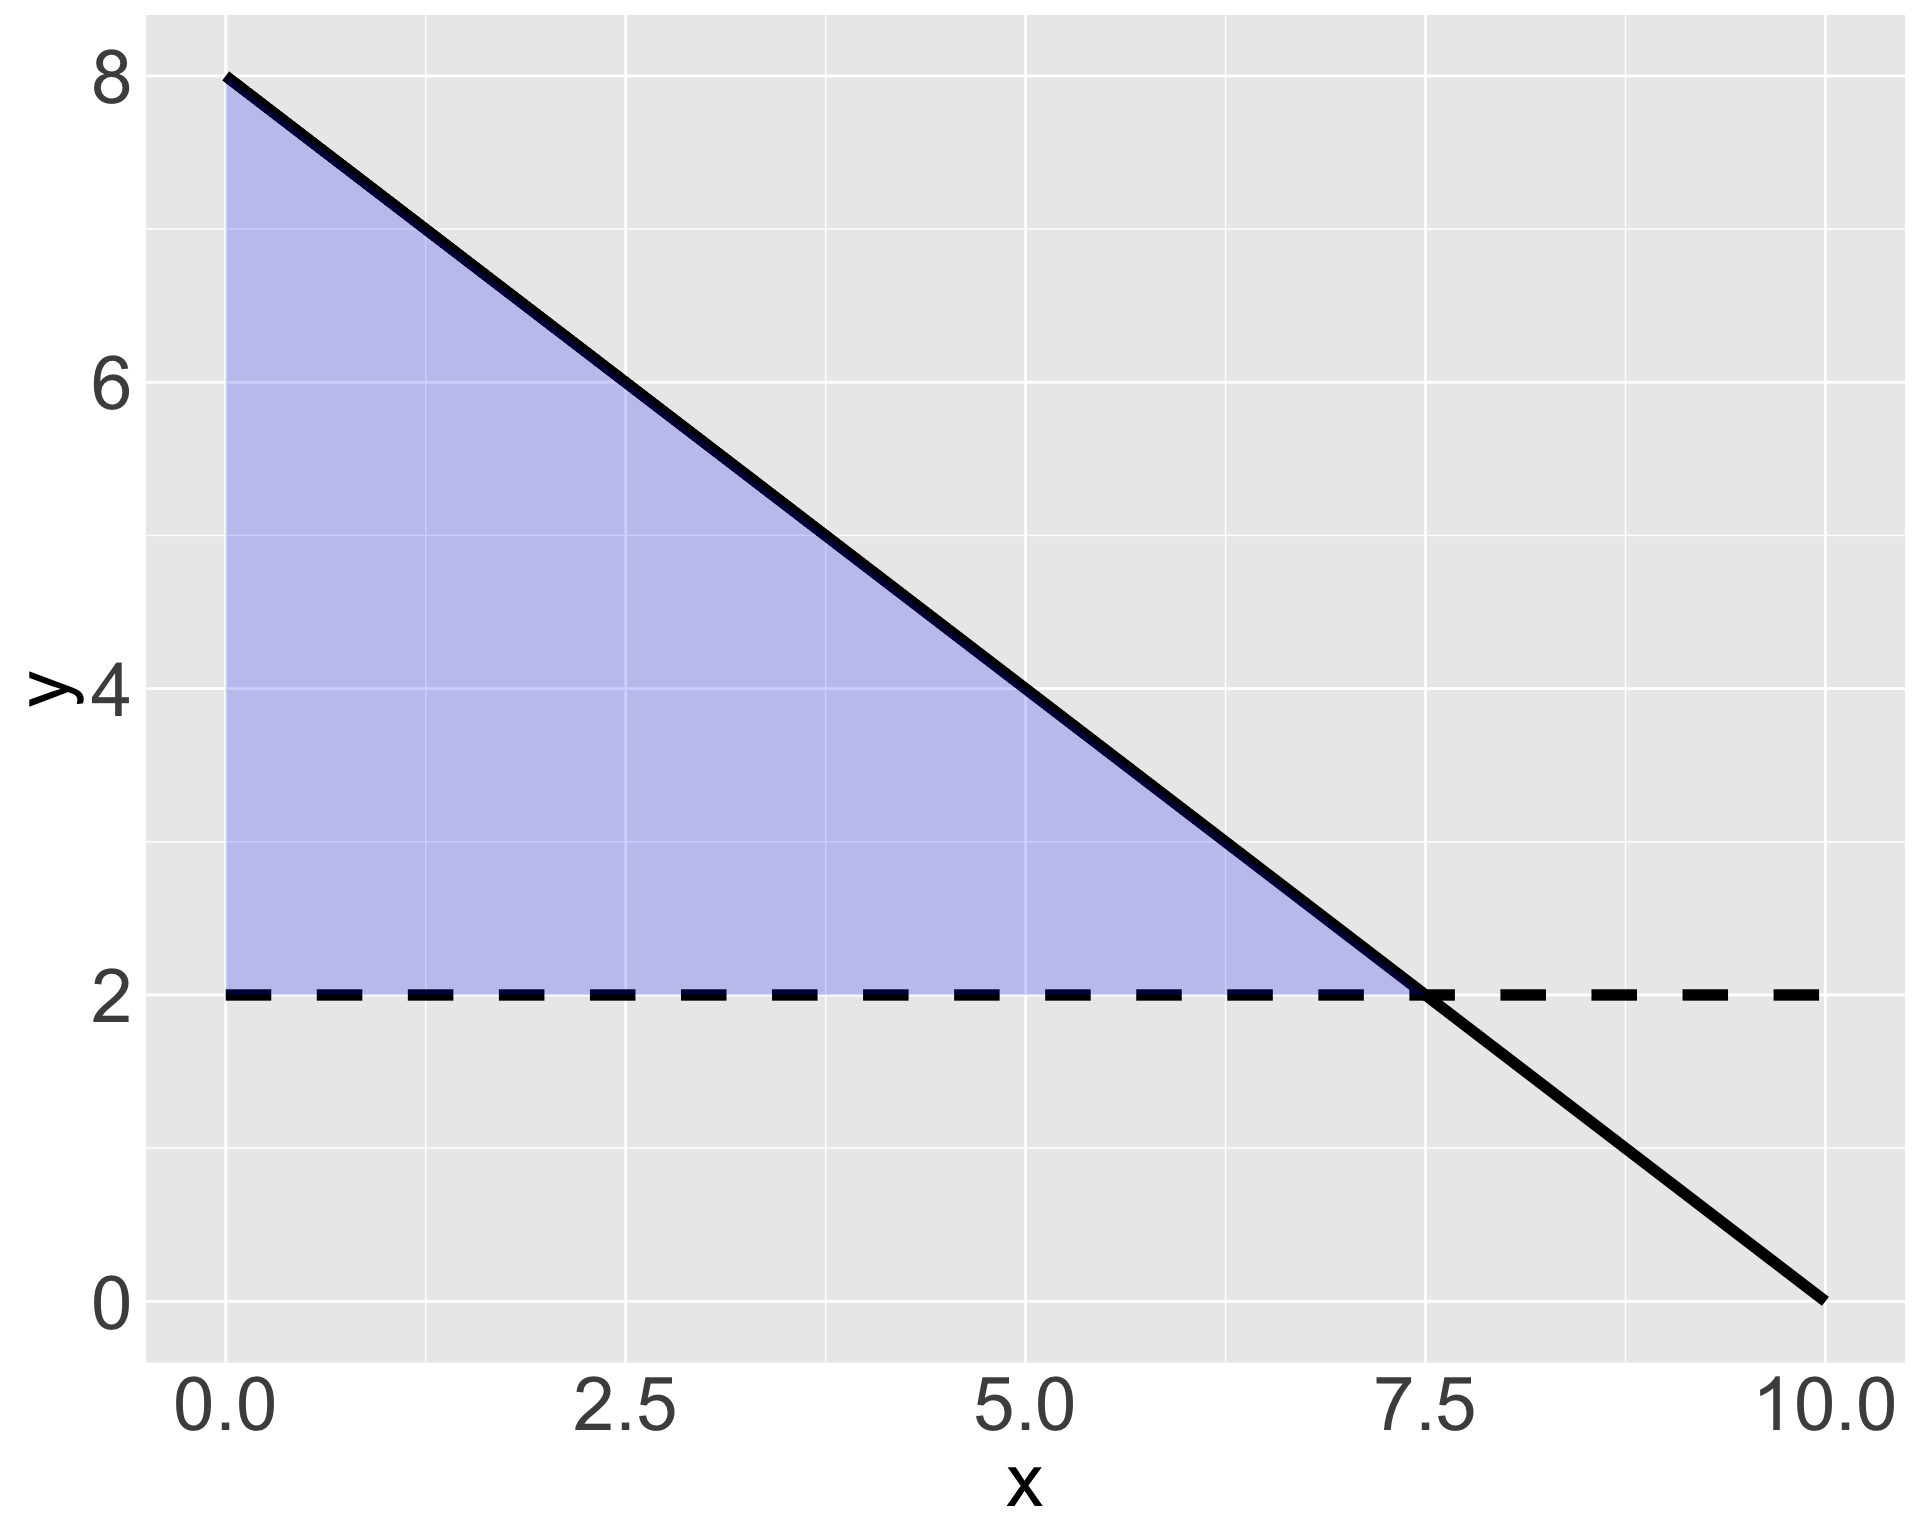
Answer
The space between the two lines and the \(y\) axis forms a triangle with height \(8 - 2 = 6\) and base \(7.5 - 0 = 7.5\). The area of the triangle is
\[ \frac{1}{2} \times 6 \times 7.5 = 22.5 \]
Maximum and Minimum Points
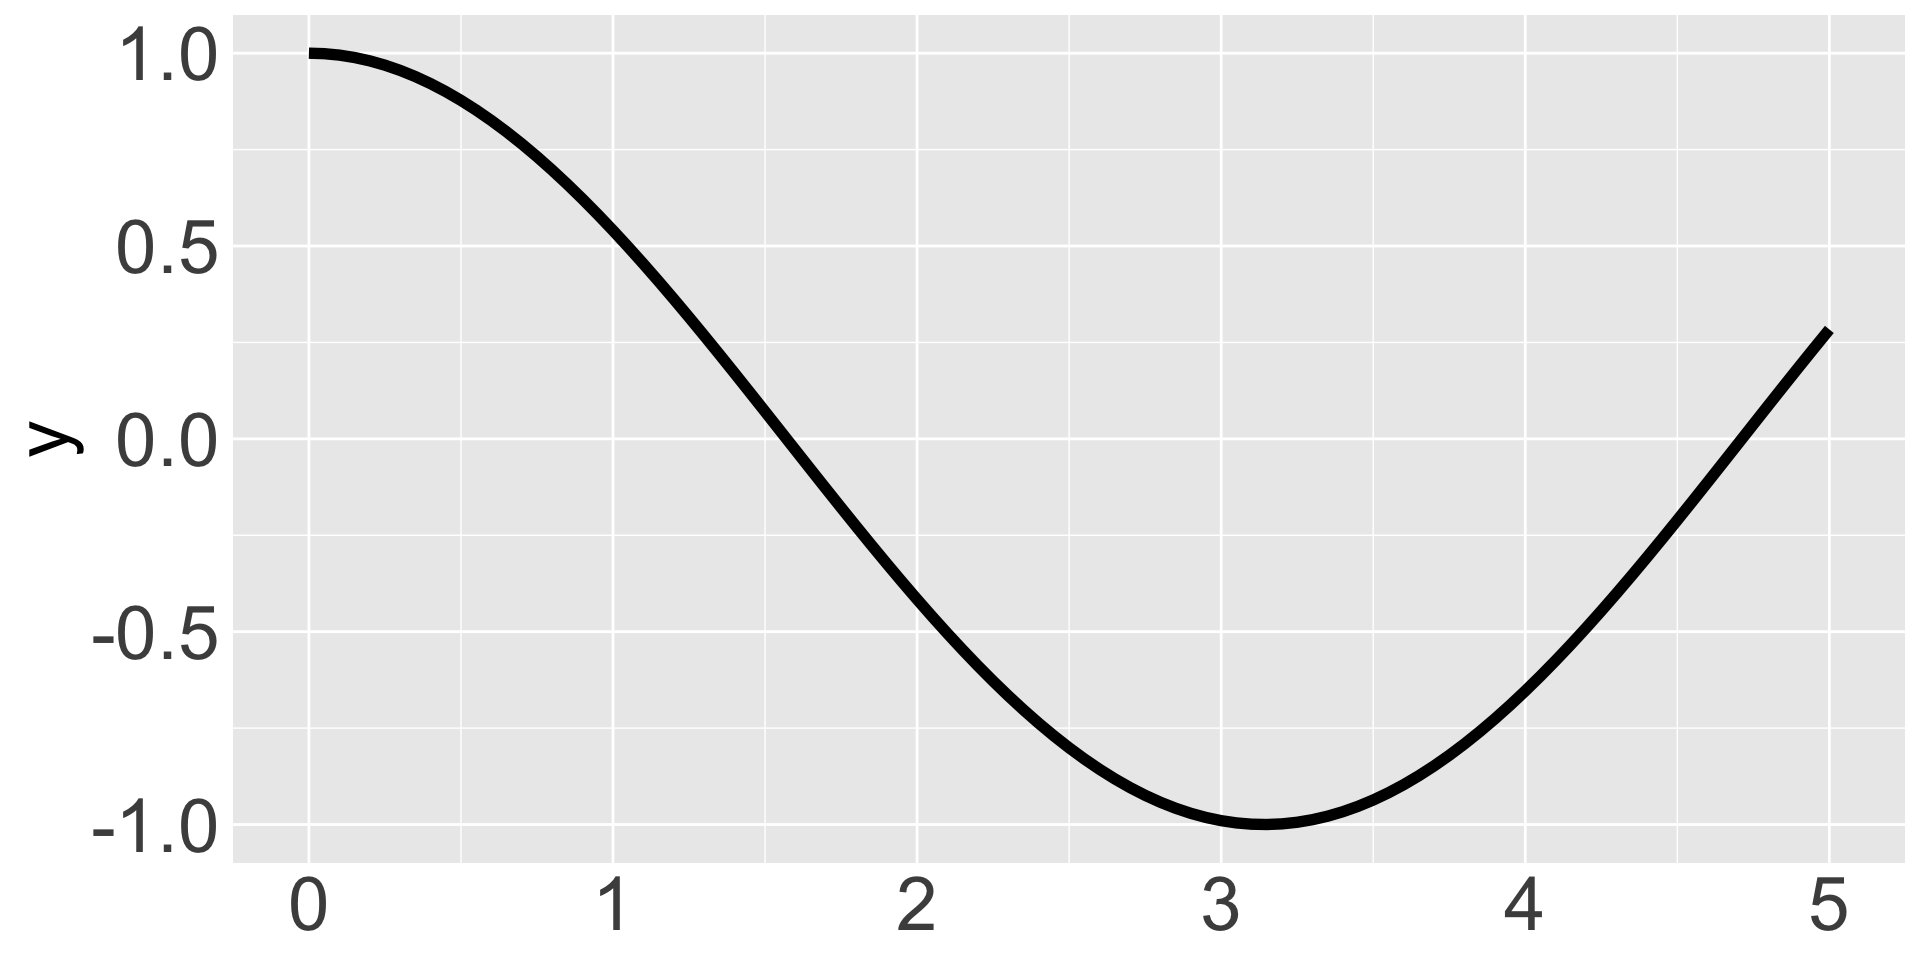
What’s the maximum value of \(y\) for the left graph? The minimum value of \(y\) for the right graph?
What are the slopes of the lines at these points?

Maximum and Minimum Points
What’s the maximum value of \(y\) for the left graph? The minimum value of \(y\) for the right graph?
What are the slopes of the lines at these points?
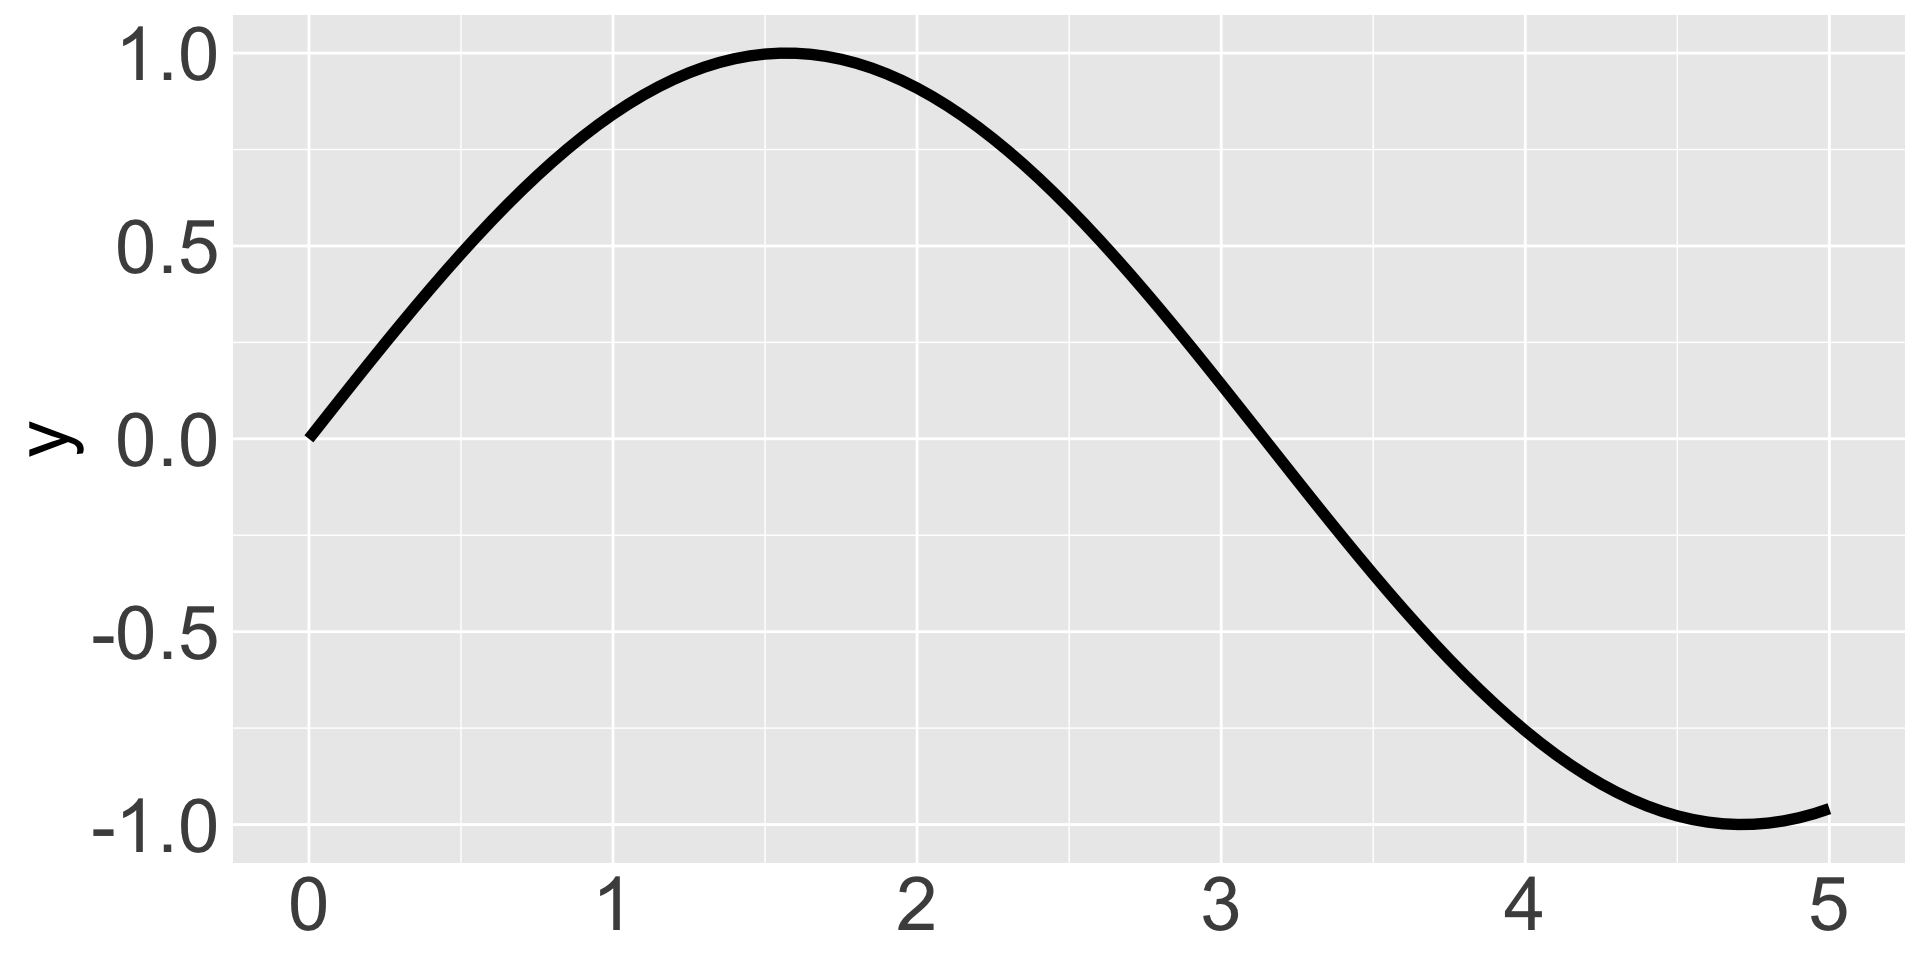

Answer
The left graph’s maximum is at \(y=1\). The right graph’s minimum is at \(y=-1\). The slope of a line at its minimum or maximum is always zero: the slope is transitioning between positive and negative at that point.
Supply and Demand
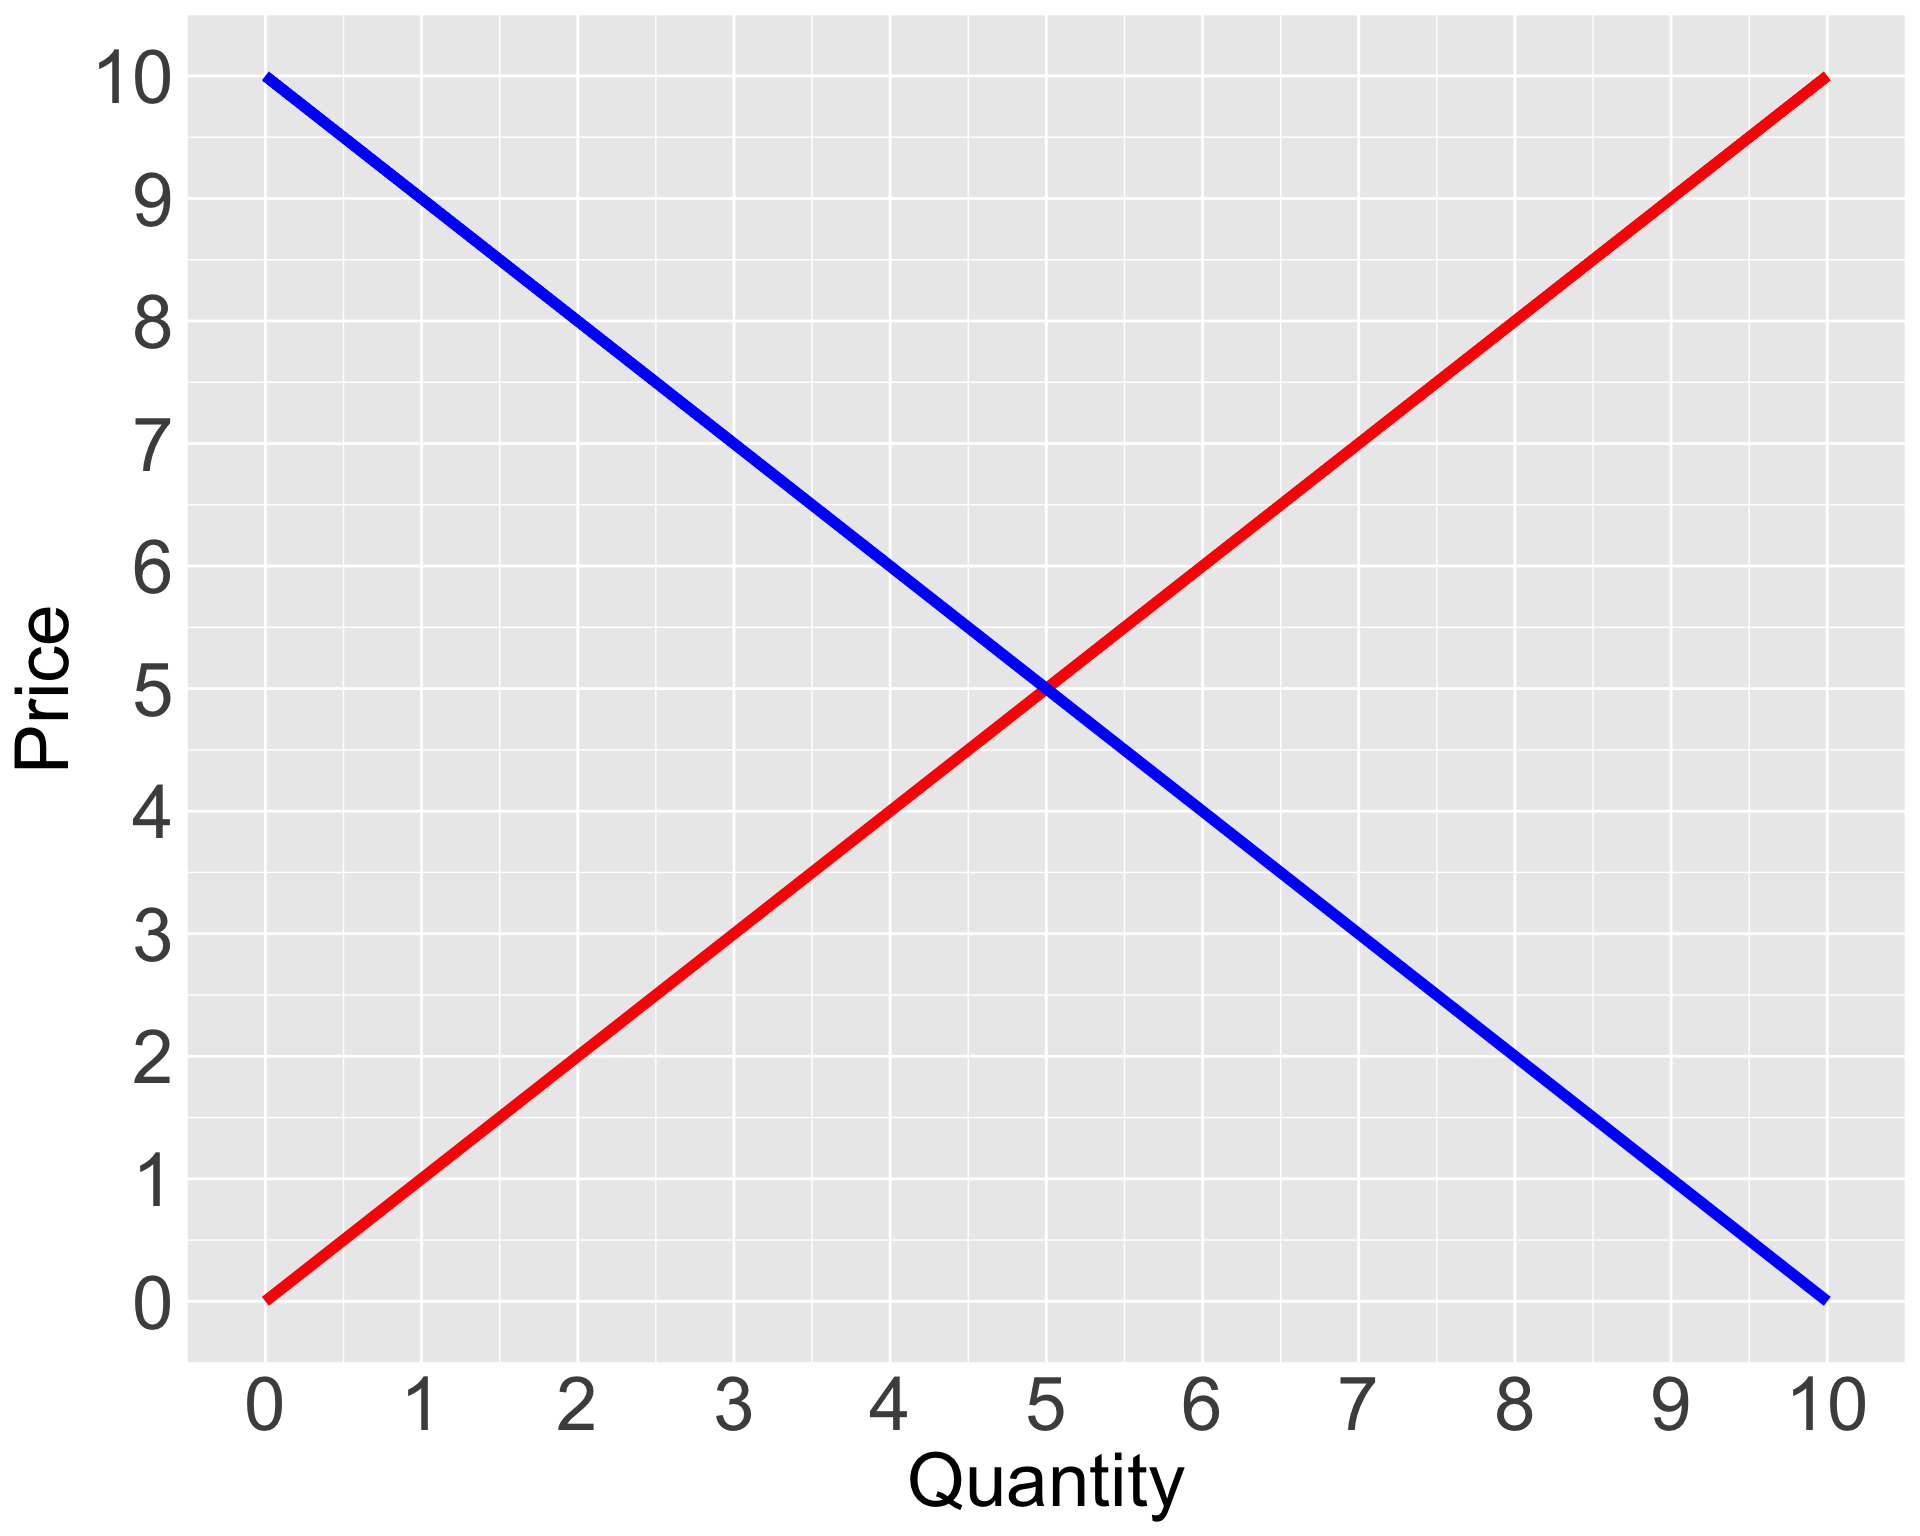
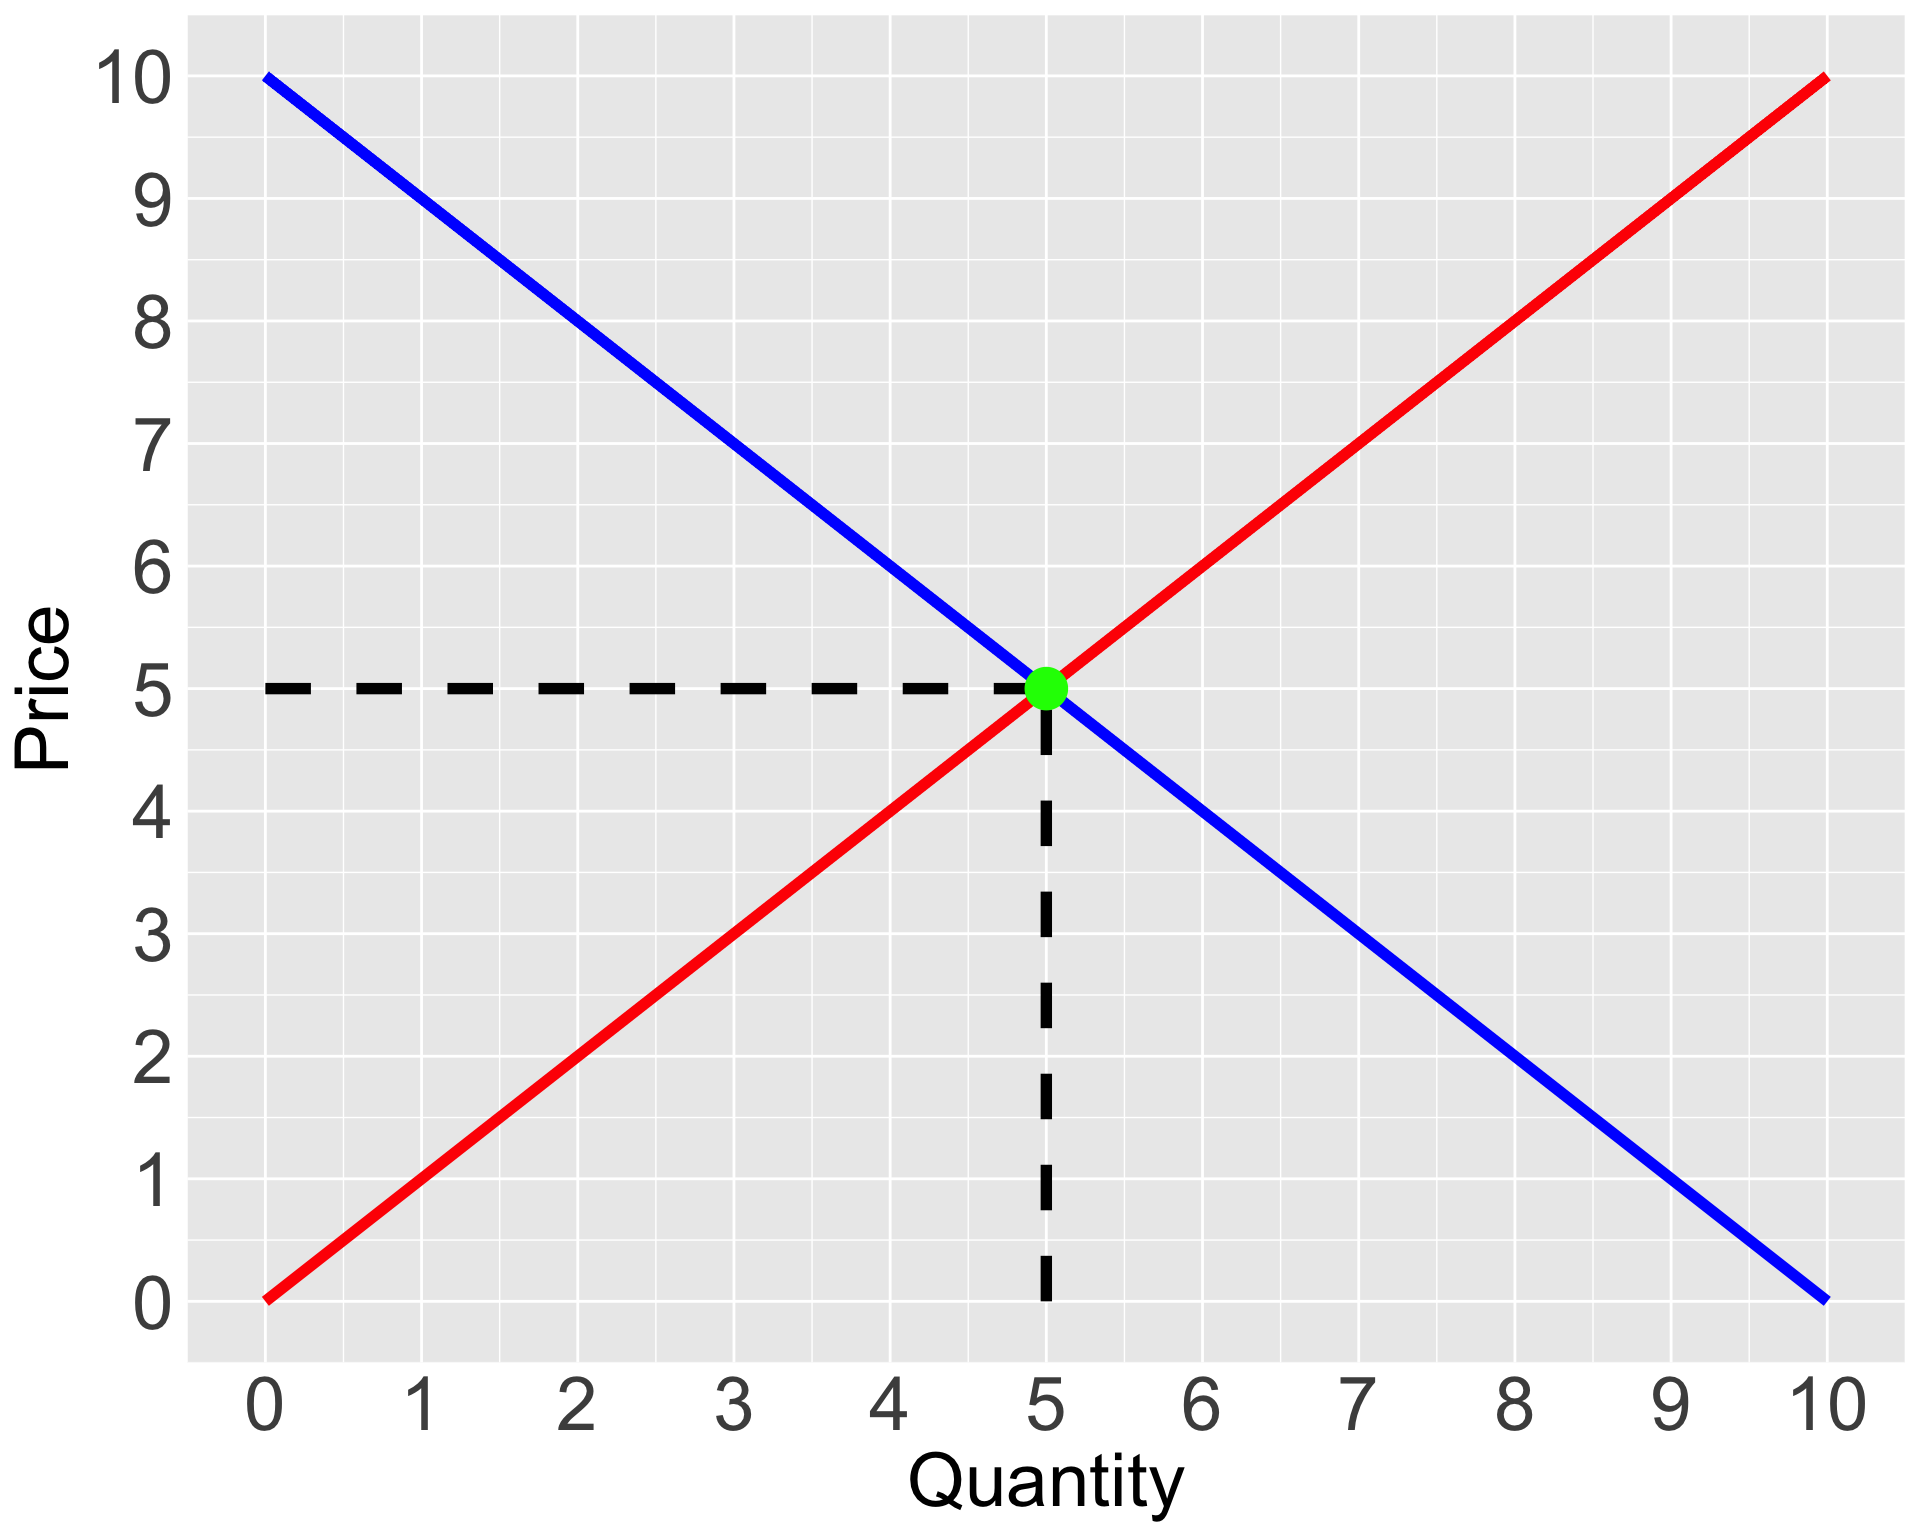
In the supply and demand graph below, which line represents the demand curve? The supply curve? What are the equilibrium price and quantity in this market?
Supply and Demand
In the supply and demand graph below, which line represents the demand curve? The supply curve? What are the equilibrium price and quantity in this market?
Answer
The demand curve is the downward-sloping blue line
The supply curve is the upward-sloping red line
The equilibrium point is where the curves intersect. The equilibrium price is $5 and the equilibrium quantity is 5 units.
Supply and Demand
A news report comes out about how the good in this market is harmful to people’s health. Would this affect the demand for the good? The supply? What would happen to the equilibrium price and quantity?

Supply and Demand
A news report comes out about how the good in this market is harmful to people’s health. Would this affect the demand for the good? The supply? What would happen to the equilibrium price and quantity?
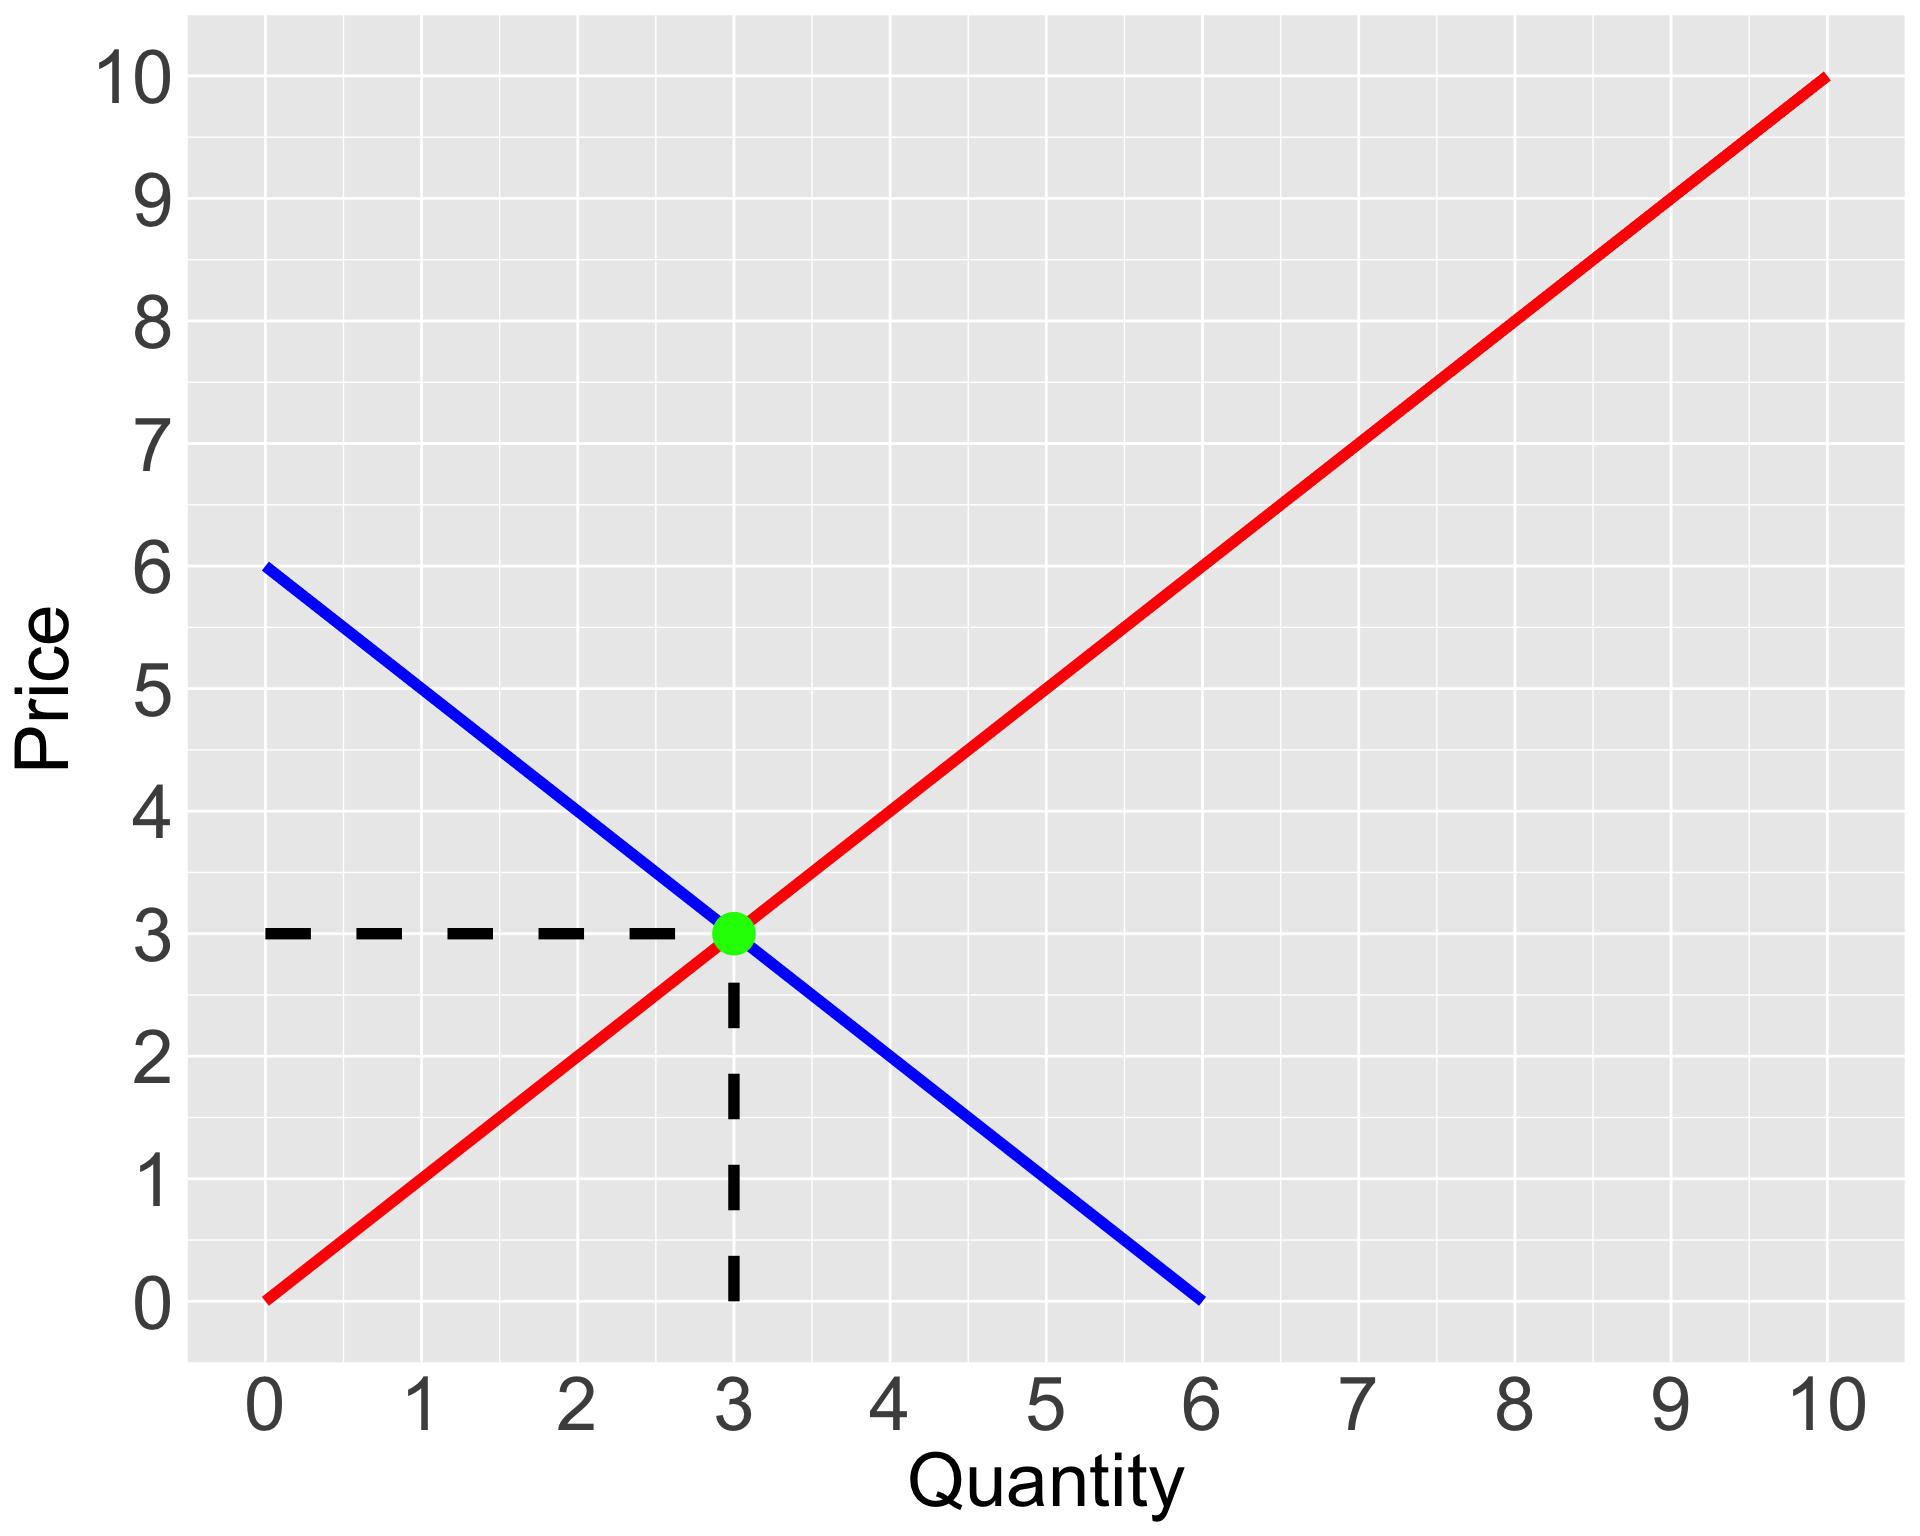
Answer
Demand for the good would fall: fewer people will want the good since it’s unhealthy! Supply wouldn’t be affected: the report doesn’t affect suppliers’ ability to produce the good.
The demand curve shifts down and we have a new equilibrium price ($3) and quantity (3).1